Eclipse 2019 Data - GLOBE Observer
Eclipse Data - July 2nd, 2019
Because the eclipse is such a time-focused event, we have also been able to pull some data sets that might be useful for a variety of people, and could save time in accessing the data. See below for air temperature data sets pulled for the date of 07/02/2019. Files can be downloaded as comma separated value (CSV) files, or Excel (XLSX) files, which preserves some formatting that may make them easier to work with. You can also go to the day of the eclipse pre-filtered on the GLOBE Visualization System.
Observations submitted through the GO app receive a unique identifier for each location from which data are submitted. The identifier is tagged to the latitude and longitude information of the submission, which is automatically obtained through the device being used to run the GO app. Each unique identifier is considered an independent unique observer for our purposes. The time of each observation was recorded to the nearest minute. The observer could choose to input temperature as either Fahrenheit or Celsius, but the temperature values were recorded in the database to the nearest degree Celsius.
Air Temperature Data
| Description | File Type | |
| Air temperature data from within the area of South America that experienced the eclipse. This includes the path of totality through Chile and Argentina, as well as the the areas of partial eclipse in the rest of Chile and Argentina, all of Ecuador, Peru, Bolivia, Paraguay, Uruguay and parts of Colombia, Brazil, Venezuela and Panama. Data from areas in South America that did not experience the eclipse are not included. This data was retrieved from the GLOBE Data Visualization System on August 26, 2019. | CSV | XLSX |
|
As above, except that columns have been added giving the percent of maximum obscuration for the reporting location, as well as the URL used to retrieve this data from from the U.S. Naval Observatory Astronomical Applications API. |
CSV | XLSX |
Clouds Data
| Description | File Type | |
|
Clouds data from within the area of South America that experienced the eclipse. This includes the path of totality through Chile and Argentina, as well as the the areas of partial eclipse in the rest of Chile and Argentina, all of Ecuador, Peru, Bolivia, Paraguay, Uruguay and parts of Colombia, Brazil, Venezuela and Panama. Data from areas in South America that did not experience the eclipse are not included. This data was retrieved from the GLOBE Data Visualization System on August 26, 2019. |
CSV | XLSX |
|
As above, except that columns have been added giving the percent of maximum obscuration for the reporting location, as well as the URL used to retrieve this data from from the U.S. Naval Observatory Astronomical Applications API. |
CSV | XLSX |
General notes about the files:
- For latitude and longitude, a negative sign represents south and west respectively.
- Elevation is measured in meters above sea level.
- "Measured at" time is in Coordinated Universal Time, or UTC (also sometimes referred to as UT). Here is one time conversion tool, but there are many others available as well.
- Air temperature (may appear as "measured value" if you pull from the GLOBE system rather than our files above) is in degrees Celsius.
Other useful resources:
- To find out the times for the beginning, ending and totality/maximum eclipse for a particular observation point (which might be useful in your analysis), in addition to the API mentioned above, the U.S. Naval Observatory also has an online form to calculate the same data.
- For Geographic Information Systems (GIS) applications, you may find the shapefiles of the eclipse shadow helpful, created by the Scientific Visualization Studio at NASA's Goddard Space Flight Center.


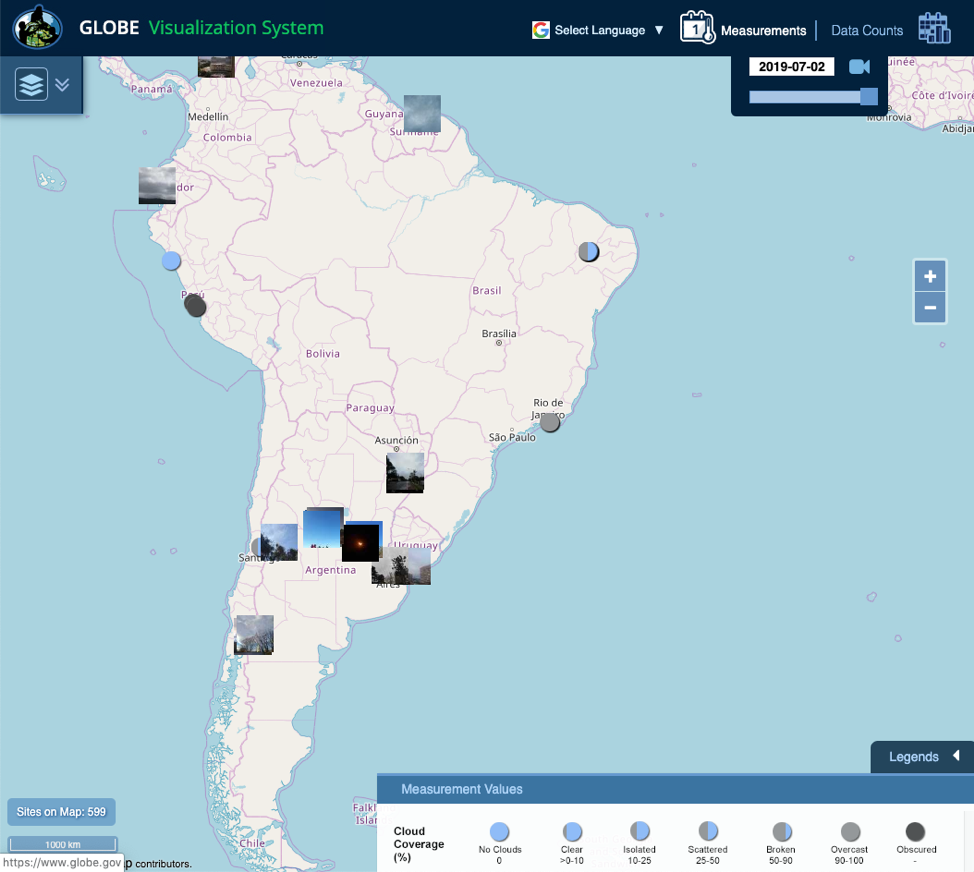
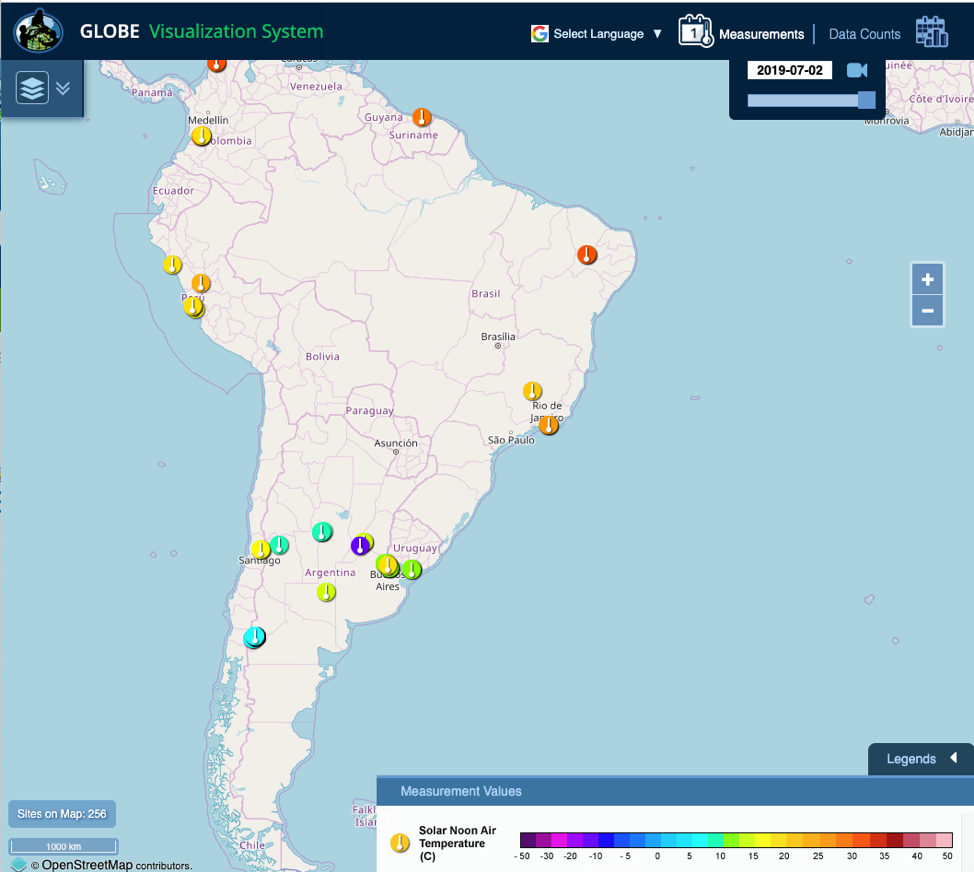
These maps shows the nearly 70 cloud observations (top) and more than 1700 air temperature measurements (bottom) collected during the total solar eclipse in South America on July 2nd, 2019.


