




Clouds Science - GLOBE Observer



Why study clouds?
Clouds are powerful agents of global change. Clouds are a key factor influencing local weather as well as the Earth’s climate system. They affect the overall temperature or energy balance of the Earth and play a large role in controlling the planet's long-term climate. We need accurate data on clouds to understand their impact over time.
By observing clouds, we can get information about temperature, moisture, and wind conditions at different heights in the atmosphere. This information helps in predicting the weather. Observations of clouds also help us know how much sunlight is reaching the ground and how easily heat from the ground and lower atmosphere can escape to space. Clouds play a central role in controlling the exchange of heat in the atmosphere and changes in clouds over time can have significant climate impacts.
More about:
Water in the environment can be a solid (ice and snow), a liquid (rain), or a gas (water vapor). As water moves from place to place it can melt, freeze, evaporate, condense or sublimate (change from solid to gas). These changes happen as the water is warmed or cooled.

Water in the atmosphere exists in all three phases (solid, liquid, gas) and changes phase depending on temperature and pressure. Like most other gases that make up the atmosphere, water vapor is invisible to the human eye. However, unlike most other gases in our atmosphere, under the right conditions water vapor can change from a gas into solid ice particles or liquid drops. If temperatures are above freezing, the water vapor will condense into water droplets. If temperatures are below freezing, as they always are high in the atmosphere, tiny ice crystals may form instead. When a large number of water droplets or ice crystals are present together, they form a visible cloud. So, clouds tell us something about air temperature and water up in the sky, related to weather. They also affect the amount of sunlight reaching the ground and how much heat is escaping back to space, related to climate.
Image Source: North Carolina Climate Office
Which types of clouds you see often depends on the weather conditions you are experiencing or will soon experience. Some clouds form only in fair weather, while others bring showers or thunderstorms. Specific cloud types can indicate a trend in the weather. For example, in middle latitudes, one can often see the advance of a warm front by watching the cloud types change from cirrus to cirrostratus. Later on, as the front gets closer, the clouds thicken and lower, becoming altostratus. As precipitation begins, the altostratus clouds become nimbostratus, immediately before the front passes your location.
Cloud type is a visible sign of the processes that are occurring in the atmosphere and provides important information about vertical movement at different heights in the atmosphere. Most clouds indicate that moist air is moving upward, and precipitation can only happen when this occurs. By paying attention to the clouds, soon you may be able to use cloud observations to forecast the weather!
Clouds play a complex role in climate. They are the source of precipitation, affect the amount of energy from the Sun that reaches Earth’s surface, and insulate Earth’s surface and lower atmosphere. At any given time, about 70% of the Earth’s surface is covered by clouds. Clouds reflect some of the sunlight away from Earth, keeping the planet cooler than it would be otherwise. At the same time, clouds absorb some of the heat energy given off by Earth’s surface and release some of this heat back toward the ground, keeping Earth’s surface warmer than it would be otherwise.

Satellite measurements have shown that, on average, the cooling effect of clouds is larger than their warming effect. Scientists calculate that if clouds never formed in Earth’s atmosphere, our planet would be over 5˚ C warmer on average. Ice crystals and water drops scatter light differently. Thick clouds absorb more sunlight than thin ones. The types of clouds, phases of water, and the amount of clouds, ice, and water drops all affect the amount of sunlight that comes through the atmosphere to warm Earth’s surface. Cloud temperature also affects how much of the emitted heat from the surface is returned from the atmosphere back to the ground.
Ice crystals and water drops scatter light differently. Thick clouds absorb more sunlight than thin ones. The types of clouds, phases of water, and the amount of clouds, ice, and water drops all affect the amount of sunlight that comes through the atmosphere to warm Earth’s surface. Cloud temperature also affects how much of the emitted heat from the surface is returned from the atmosphere back to the ground.
Image Source: NASA's Earth Observatory
Conditions on Earth’s surface affect the amount and types of clouds that form overhead. This helps to shape local climate. For example, in rain forests, the trees release large amounts of water vapor. As daily heating causes the air to rise, clouds form and intense rainstorms occur. Over three-quarters of the water in tropical rain forests is recycled in this way. For most of the year, the sky is almost completely covered by clouds. In contrast, in a desert there is no surface source of moisture and clear conditions are typical. These clear conditions allow for more heating by sunlight and higher maximum temperatures. In both cases, the local climate – precipitation and temperature – is tied to cloud conditions (formation and type).
Human activities also can affect cloud conditions. One specific and obvious example is the formation of contrails or condensation trails. These are the linear clouds formed when a jet aircraft passes through a portion of the atmosphere having the right combination of moisture and temperature. The jet exhaust contains water vapor as well as small particles – aerosols – that provide condensation nuclei for the water vapor to condense onto and help ice crystals begin to form. In some areas, jet traffic causes a noticeable change in cloudiness, which may affect both weather and climate.
How will clouds change if Earth’s surface becomes warmer on average? If the surface water of oceans and lakes warms, more water will evaporate. This should increase the total amount of water in the atmosphere and the amount of cloud cover, but what type of clouds will form? Will the increase in clouds happen mostly at high altitudes or low altitudes? Clouds at all altitudes reflect sunlight and cool Earth’s surface, but high clouds release less heat to space and thus warm the surface more than low clouds. So, the changes in surface temperatures may depend on how cloud conditions change. The interaction of clouds and surface temperature is complex and scientists are currently researching how this process will unfold in the future.
Why does NASA want this information?

And satellites can only capture a top-down view of our planet. We need your ground observations to complement what the satellite cannot see, for example, cloud bases, ground cover, and multiple cloud layers. Our eyes are great detectors and can give researchers some very important information. By putting these two vantage points together, satellites from above and ground observations from below, we get a much more complete picture of clouds in the atmosphere.
The science lead for the Clouds tool, Marilé Colón Robles, gives updates about recent research being done using the data collected via the GLOBE Observer app. (Originally aired during the GLOBE Observer Connection-Conversation-Celebration event held 26 July 2022.)
Comparing Your Observations to Satellite Data
Citizen science data from GLOBE Observers give an important perspective on clouds, showing what we see from the ground looking up (versus what satellites ”see” looking down!) While observations any time are helpful, matching observations to satellite data can make data collection more interesting and rewarding.
The GLOBE Observer app enables you to look up satellite overpass (flyover) times for your location to be able to compare your surface-level data more directly with information collected by NASA satellites. Select “Check Satellite Flyovers” from the home screen of the Clouds tool to determine these times, set notifications reminding you 15 minutes before the satellite passes over, and customize your notifications (e.g., days of the week, time, and satellites).
Satellite Comparison Emails
When you submit a GLOBE observation that coincides with a geostationary satellite or an Earth orbiting satellite flying overhead, you should receive an email from the GLOBE Clouds team at NASA’s Langley Research Center with comparison information. (Go to settings in the app to make sure you have opted in to receiving these communications.) The satellite comparison email shows how your surface-based observation compares with data collected by the satellite(s). The email will include a table with a side-by-side comparison of the satellite data. Learn which satellites your GLOBE Observation may be matched to below.
Observations of clouds from the ground help NASA better understand satellite data because differences between the two provide valuable insights. Discrepancies do not necessarily imply an error on the part of the user or in the satellite data. Differences may occur because of differences in scale and perspective.
Satellite Data Compared to Your Observations
The GLOBE Clouds team at NASA Langley Research Center matches your ground-level cloud observations to data from multiple satellites. Your observations are matched to geostationary and polar orbiting satellites. Find more information about the difference between these satellites in the following section.
Emails sent with comparisons to geostationary satellites usually take only a few days, but comparisons to other satellites could take longer.
| Satellite Name | Orbit | Instrument | GLOBE Program’s Match Period |
|---|---|---|---|
| GOES East |
Geostationary |
ABI | 2017 - current |
| GOES West |
Geostationary |
ABI | 2017 - current |
| Meteosat | Geostationary (Eastern Hemisphere) |
FCI | 2017 - current |
| Himawari | Geostationary (Eastern Hemisphere) |
AHI | 2017 - current |
| NOAA-20 | polar orbiting (global, 1:30pm local solar time) |
CERES | 2022 - current |
| PACE | polar orbiting (global, 1pm local solar time) |
OCI | 2026 - current |
| CALIPSO | polar orbiting | CALIOP | 2017 - 2023 |
| Terra | polar orbiting | CERES | 2017 - 2025 |
| Aqua | polar orbiting | CERES | 2017 - 2023 |
Geostationary versus polar orbiting satellites
Satellites that stay above a location on Earth are in geostationary or geosynchronous Earth orbit, or GEO. These satellites orbit about 23,000 miles above the equator and complete one revolution around Earth precisely every 24 hours. This means that they have a continuous view of one location on Earth. No matter when you take your clouds observation, your data will be matched with the geostationary satellite that is orbiting over your location. There is no need to request an overpass schedule or alert for geostationary satellites, and they are not included in the satellite overpass schedule.
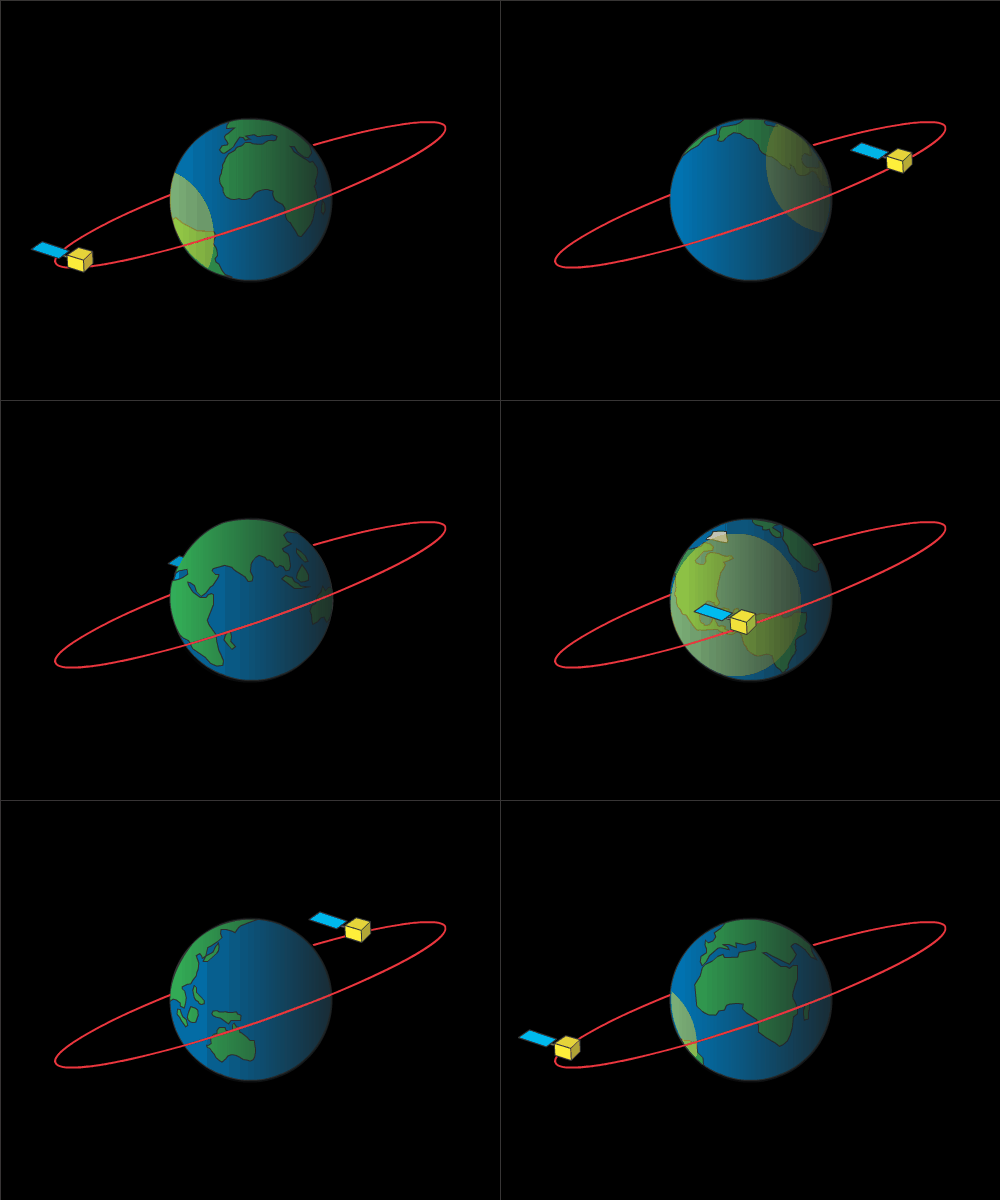
Any satellite with an orbital path going over or near the poles has a polar orbit. Polar orbits are usually low Earth orbits. Eventually, Earth’s entire surface passes under a satellite in polar orbit. Everyone may receive a match to satellites in polar orbit if they collect data when the satellite is overhead. Check the satellite overpass schedule to find out when a polar orbiting satellite will be over your location.
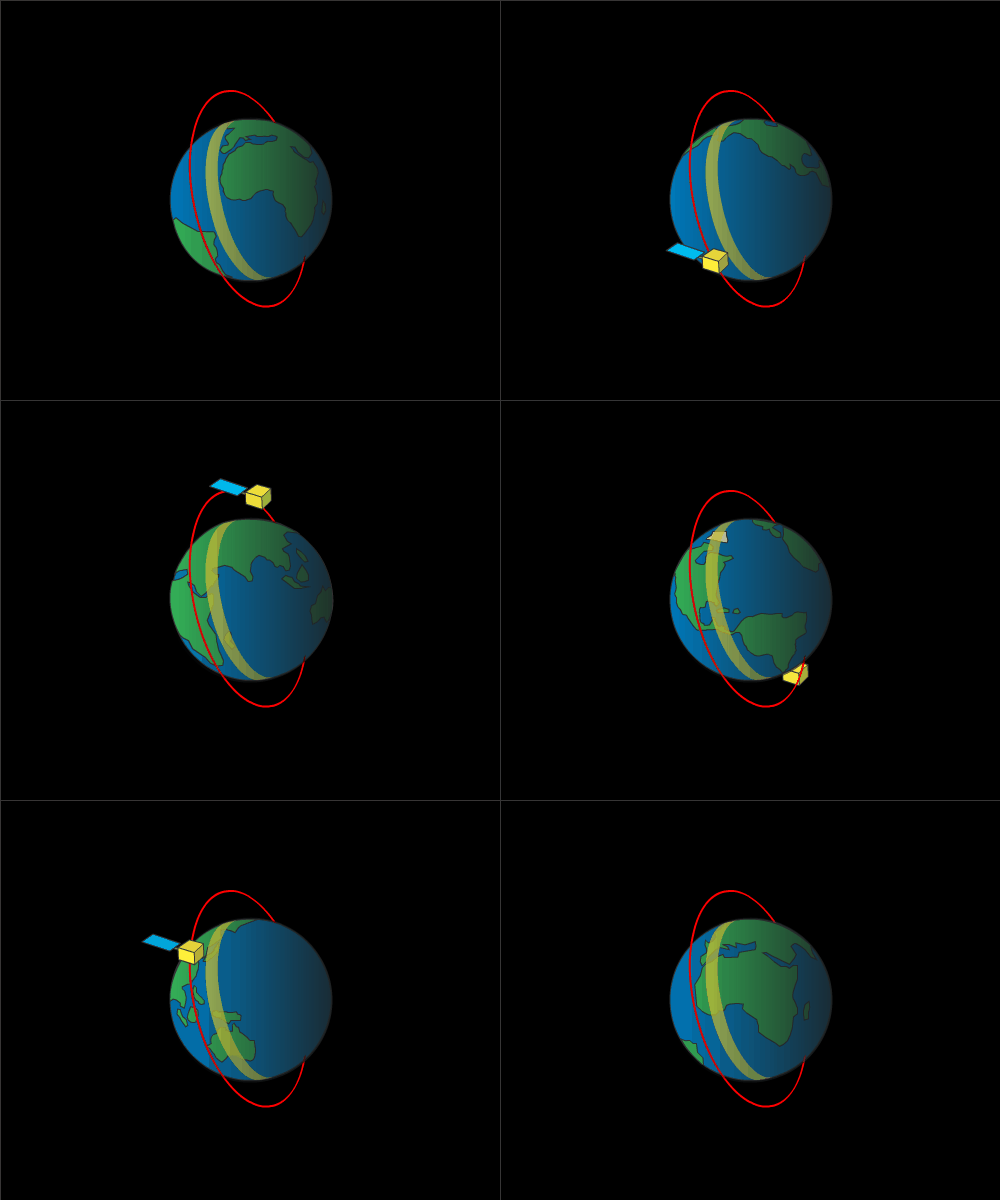
Adapted from NASA SpacePlace.
More Information
Access the satellite overpass schedule (web version)
How to access the cloud satellite comparison table
How to read the cloud satellite comparison table
Interpret cloud satellite data
Compare your cloud observations with satellite data
Comparing Ground Observations and Satellite Data - Video
This video shows three examples (from September 2016) of ground observations from compared to satellite overpasses of Aqua's 
Quick Facts About Clouds
A cloud is a mass of tiny water drops or ice crystals that floats in the air above Earth. Water on land or in the ocean evaporates, turning from a liquid to a gas called water vapor. The water vapor rises, cools, and then turns back into a liquid, forming tiny droplets. Enough of these droplets make a cloud.
Clouds form from water in the sky. The water may evaporate from the ground or move from other areas. Water vapor is always in the sky in some amount but is invisible. Clouds form when an area of air becomes cooler until the water vapor there condenses to liquid form. At that point, the air is said to be "saturated" with water vapor. The air where the cloud forms must be cool enough for the water vapor to condense. The water will condense around things like dust, ice or sea salt - all known as condensation nuclei. The temperature, wind and other conditions where a cloud forms determine what type of cloud it will be.
Cirrus clouds are thin and wispy and often curve with the wind. Cumulus clouds tend to be big and fluffy. These clouds look kind of like giant cotton balls or other shapes in the sky. As a middle-level cloud, this type also can form parallel stripes of clouds. Stratus clouds form sheets of clouds that cover the sky.
Clouds are categorized primarily by two major factors - location and shape. High clouds form several kilometers up in the sky, with the exact height depending on the temperatures where they form. Low clouds generally form within a kilometer or two of Earth's surface. In fact, low clouds can even form touching the ground, when they are called fog. Middle-level clouds form between low and high clouds.
Clouds are important for many reasons. Rain and snow are two of those reasons. At night, clouds reflect heat and keep the ground warmer. During the day, clouds make shade that can keep us cooler.
Most of the water in clouds is in very small droplets. The droplets are so light they float in the air. Sometimes those droplets join with other droplets. Then they turn into larger drops. When that happens, gravity causes them to fall to Earth. We call the falling water drops "rain." When the air is colder, the water may form snowflakes instead. Freezing rain, sleet or even hail can fall from clouds.
Not all clouds produce rain or other types of precipitation (snow, sleet, freezing rain). The latin word “nimbus” means rain and is added as a prefix or suffix to the two clouds that produce precipitation: nimbostratus clouds or cumulonimbus clouds.
Tune in to the evening weather report on any given day, and you’ll no doubt see satellite images of clouds. For years, experts have used cloud observations to predict the weather, from forecasting extreme weather events, such as tornadoes and hurricanes, to simply telling people whether they need to take an umbrella or sunscreen on their afternoon picnic. Weather experts monitor clouds with the help of satellite data, and they use cloud height and motion data to calculate wind speed and height. Although these calculations have proven useful in predicting the path and severity of developing storms, existing satellite instruments are limited in their coverage of vast ocean expanses and higher latitude regions, the common birthplaces of many storms.
Low, thick clouds primarily reflect solar radiation and cool the surface of the Earth. High, thin clouds primarily transmit incoming solar radiation; at the same time, they trap some of the outgoing infrared radiation emitted by the Earth and radiate it back downward, thereby warming the surface of the Earth. Whether a given cloud will heat or cool the surface depends on several factors, including the cloud's altitude, its size, and the makeup of the particles that form the cloud.
Clouds are part of the water cycle assisting in the movement of water from place to place which is very important for the survival of life on Earth. In addition to producing rain, sleet or snow, clouds can provide shade on a warm day. Some clouds help to cool the surface of the Earth while others keep it warm, both work to help maintain balance of the energy coming from the Sun.
Clouds are important for many reasons. Precipitation, like rain or snow, is one of those reasons. At night, clouds reflect heat back to the surface and keep it warmer. During the day, clouds can shade us from the sun and keep Earth cooler. Studying clouds helps NASA better understand Earth's weather and climate.
NASA uses satellites in space as well as computers to study clouds. NASA also studies clouds on other planets. Mars has clouds that are like the clouds on Earth. But other planets have clouds that aren't made of water. For example, Jupiter has clouds made of a gas called ammonia.
The existing long-term collection of cloud measurements made by surface observers provides an important baseline record of cloud phenomena. These historical observations provide a useful context in which to study clouds. Observations collected by surface observers provide information that can be observed by the human eye that might be missed by the satellite, for example whether or not there is snow on the ground is something that satellites cannot distinguish from cloud cover. Through the GLOBE program, participants have the opportunity to submit their cloud observations to provide scientists with validation for satellite observations.
Clouds are very important and help make the Earth habitable. Clouds can cool the planet by reflecting the sun’s rays, or warming the planet especially on cold cloudy nights. Clouds are also important at how water moves around the Earth, and where it rains most or very little.
Publications Related to GLOBE Clouds
For a more complete list of GLOBE Observer publications and presentations, visit the publications page.

Dodson, J. B., Robles, M. C., Rogerson, T. M., & Taylor, J. E. (2022). Do citizen science Intense Observation Periods increase data usability? A deep dive of the NASA GLOBE Clouds data set with satellite comparisons. Earth and Space Science, 9, e2021EA002058. https://doi.org/10.1029/2021EA002058
Technical Report: GLOBE Observer Data: 2016–2019
Amos, H. M., Starke, M. J., Rogerson, T. M., Colón Robles, M., Andersen, T., Boger, R., Campbell, B.A., Low, R.D., Nelson, P., Overoye, D., Taylor, J. E., Weaver, K. L., Ferrell, T., Kohl, H., & Schwerin, T. G. (2020). GLOBE Observer Data: 2016–2019. Earth and Space Science, 7(8). https://doi.org/10.1029/2020EA001175
Clouds around the world: How a simple citizen science data challenge became a worldwide success
Colón Robles, M., Amos, H. M., Dodson, J. B., Bouwman, J., Rogerson, T. M., Bombosch, A., Farmer, L., Burdick, A., Taylor, J. E. & Chambers, L.H. (2020). Clouds around the world: How a simple data challenge became a worldwide success. Bulletin of the American Meteorological Society, 101(7), E1201-E1203. https://doi.org/10.1175/BAMS-D-19-0295.1

Integrating Tech: Making Science Come Alive With Clouds
Colón Robles, M., Bouwman, J., & Smith-Long, C. (2019, November/December). Integrating tech: making science come alive with clouds. Science Scope, 43(4), 8-12.

Connecting a Community of Observers Directly to NASA Satellites
Hayden, L., Taylor, J., & Colón Robles, M. (2019, March). GLOBE: Connecting a community of observers directly to NASA satellites. IEEE Geoscience and Remote Sensing Magazine, 7(1), 98-99. https://doi.org/10.1109/MGRS.2019.2891930
Eclipse Across America: Citizen Science Observations of the 21 August 2017 Total Solar Eclipse
Dodson, J.B., Colón Robles, M.,Taylor J.E., DeFontes, C.C., & Weaver K.L. (2019). Eclipse across America: Citizen science observations of the 21 August 2017 total solar eclipse. Journal of Applied Meteorology & Climatology, 58(11), 2363-2385. https://doi.org/10.1175/JAMC-D-18-0297.1

Chambers, L. H., McKeown, M. A., McCrea, S. A., Martin, A. M., Rogerson T. M., & Bedka, K.M. (2017). CERES S’COOL Project update: The evolution and value of a long-running education project with a foundation in NASA Earth science missions. Bulletin of the American Meteorological Society, 98(3), 473–483. https://doi.org/10.1175/BAMS-D-15-00248.1

Ault, T. W., Czajkowski, K. P., Benko, T., Coss, J., Struble, J., Spongberg, A., Templin, M and Gross, C. (2006). Validation of the MODIS snow product and cloud mask using student and NWS cooperative station observations in the Lower Great Lakes Region. Remote Sensing of Environment, 105(4), 341–353. https://doi.org/10.1016/j.rse.2006.07.004

Chambers, L. H., Young, D. F., Costulis, P. K., Detweiler, P. T., Fischer, J. D., Sepulveda, R., Stoddard, D. B., & Falcone, A. (2003). The CERES S'COOL Project. Bulletin of the American Meteorological Society, 84(6), 759–766. https://doi.org/10.1175/BAMS-84-6-759