News - GLOBE Observer
What’s up in your sky? Your cloud observations in action
Your cloud observations are making a huge impact, especially those that include information about cloud types and photographs. We’ve noticed how some of you have been reporting unique events like dust storms and fires, so it got us excited to make a new data challenge, the NASA GLOBE Fall Challenge. We are asking YOU to tell us what’s up in your sky.
See clouds? Then use the steps within the app to report total cloud cover and cloud types, and don’t forget to add your photographs of the sky. Are you seeing something else in the sky like dust, haze or even smoke? Then use the steps below to send in the report and photographs! Use these tips to help you figure out if you are looking at clouds or at an obscuration like smoke or dust.
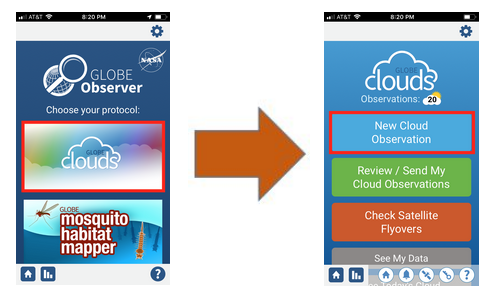
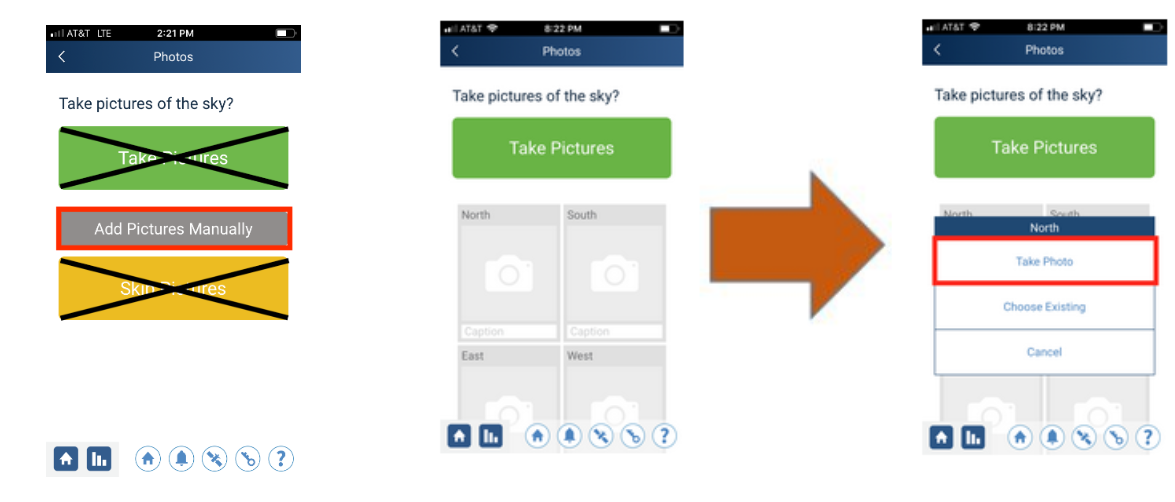
First, use the GLOBE Observer app and select clouds and choose “New Cloud Observation”.
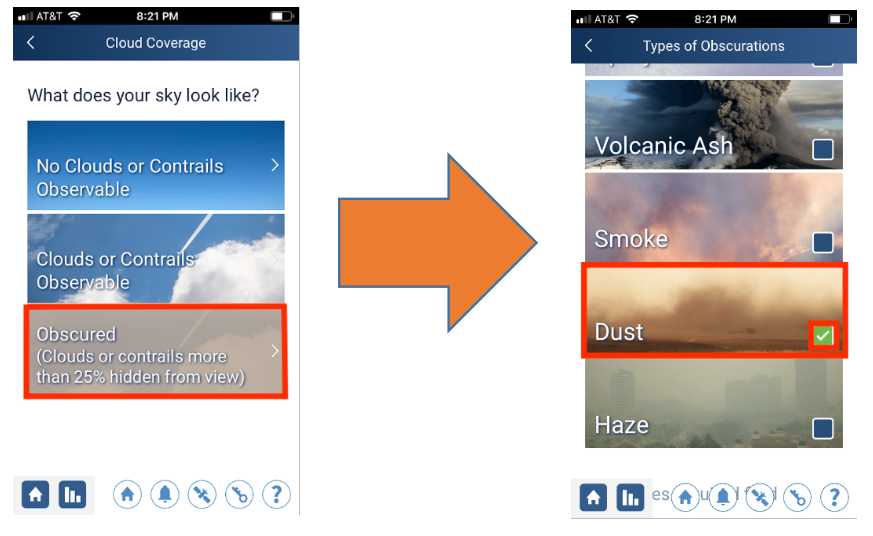
Then, select “Obscured” to report those unique events and select the option that best describes what you see.
Now, we REALLY want those photographs, but choose “Add Pictures Manually” and make your best guess at the direction of the event.
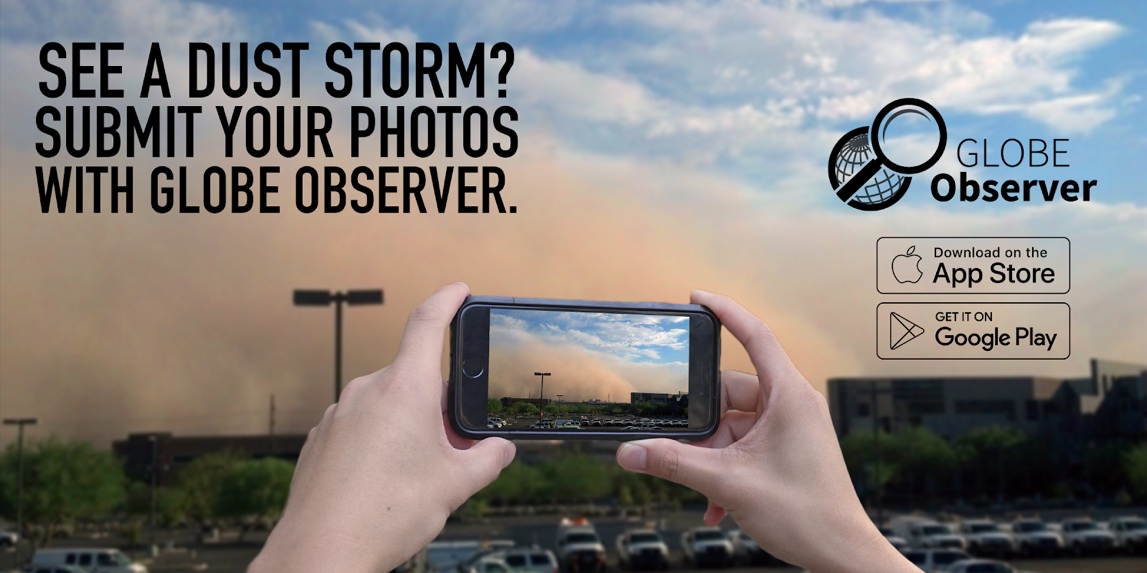
Scientists around the world are paying attention to your photographs of these events, especially dust storms! Learn more about how to make these special reports and the scientists looking at your data right now.
Results of the 2018 GLOBE Clouds Spring Data Challenge
The NASA GLOBE Clouds team created an event to (1) increase the number and locations of collocated ground observations with cloud-observing satellites; (2) engage the general public with cloud observations through the use of the GLOBE Observer mobile app; (3) collect observations of varying cloud types during Northern Hemisphere Spring. The result was the 2018 NASA GLOBE Clouds Spring Data Challenge that asked YOU to make up to ten cloud observations per day March 15 - April 15, 2018.
The challenge resulted in over 55,000 observations collected from more than 15,000 locations in 99 countries, on every continent, including Antarctica.
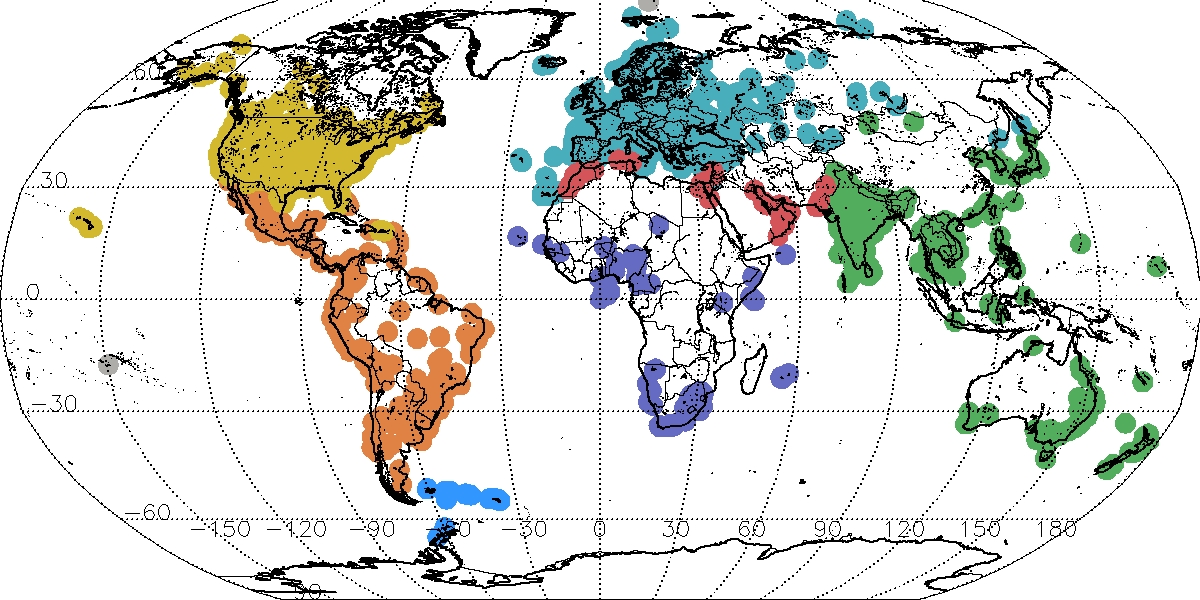
Total cloud observations reported by GLOBE Observer users during the 2018 GLOBE Clouds Spring Data Challenge, color coded by political region as defined by the GLOBE Program ( https://www.globe.gov/globe-community/community-map ).
Eclipse Across America: Citizen Science Observations of the 21 August 2017 Total Solar Eclipse Research Paper Now Available
Researcher Dr. J. Brant Dodson at NASA Langley Research Center with SSAI led a study that used clouds and temperature data reported by GLOBE Observers during the 2017 North American Solar Eclipse. Dr. Dodson was able to compare the temperature changes measured during the eclipse to different total cloud cover reports along the path of totality. This study highlights the importance of volunteers like you who can collect data in unique locations and make comparable observations to other datasets already used in research. The study was published in the Journal of Applied Meteorology and Climatology and is available at https://journals.ametsoc.org/doi/10.1175/JAMC-D-18-0297.1.
Marilé Colón Robles (NASA Langley, SSAI) is the project scientist for NASA GLOBE Clouds based out of the Science Directorate at NASA Langley Research Center with Science Systems and Applications, Inc. Marilé works with scientists on ways to include citizen science data into research. She also works with students and teachers in the U.S. and around the world on how to engage in real-world STEM activities and in authentic science through the GLOBE Program.
Comments
View more GLOBE Observer news here.


