News - GLOBE Observer
Laying the Groundwork for Land Cover Satellite Comparisons
The GLOBE Observer team was fortunate this summer to have two interns
working on projects related to satellite matching. One of the projects
was to help lay the groundwork for adding the capability for satellite
comparisons for land cover data, similar to what is available for
clouds observations. You can read more about that project below. The
second project focused on making the existing cloud satellite matches
more easily accessible to users through improvements
to the My Observations page (described in a separate blog post).
You can also watch a video presentation of the interns
explaining their project themselves.
Project 1: Creating Satellite Match Tables for Land Cover Data (Sidd Jasti)
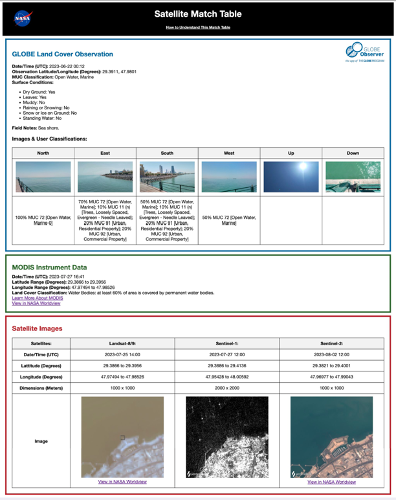
I worked on creating a process to provide users submitting a land cover observation with a match table that includes corresponding satellite data and images. This allows observers to compare their data values collected on the ground with those collected from satellites. The table enables users to look at their recorded land cover data values, including surface conditions, photos of the land, Modified UNESCO Classification (MUC) codes and descriptions, and field notes, and then compare/contrast those values with images and land cover classifications provided by satellites.

I also used images from ESA’s Sentinel-1 satellite to provide the users with data in a different wavelength that offers alternative information. Sentinel-1’s Synthetic Aperture Radar (SAR) uses microwaves to penetrate through clouds to record the land both day and night. These images display the microwave backscatter using white and black colors, with the lighter regions representing land/man-made buildings and the darker regions representing water or roads. Along with satellite imagery, I incorporated the Moderate Resolution Imaging Spectroradiometer (MODIS) instrument on the Aqua and Terra satellites, which provides 36 wavelengths of information. By combining select wavelengths, MODIS generates an annual database that classifies global land cover. I provided this information in the satellite match table so users can compare the MODIS land cover classification with the user’s reported MUC description.
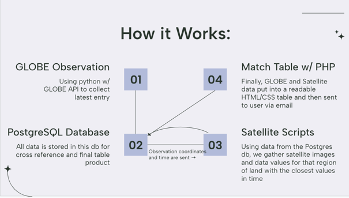
I then needed to find a platform where I could fetch data from the satellites using Python scripts, given some constraints. For example: a maximum of 25% cloud cover and the most recent acquisition within a 1000m x 1000m area surrounding the observation. I found that Google’s Earth Engine was a great resource that provided a myriad of datasets from a number of satellites. I was able to use this resource to gather images from Landsat 8/9, Sentinel-1 & 2, as well as get the MODIS land cover classification. I also used NASA’s Worldview tool to provide links in the match table so the user can further explore the satellite’s dataset.
With the information compiled, I designed the comparison table using
HTML, CSS, and PHP for an inform
While my internship is concluding, there are many ways this project can be expanded in the future. As with the cloud tables, a user feedback submission tool is critical for improving the system via community input. We also want to make a curated dataset containing all produced match tables to allow easy access for anyone wanting to view the tables on their own, and to potentially use them for research. Finally, in the future, we could expand the match tables to the two remaining tools within the app: Mosquito Habitat Mapper and Trees. I would like to add that this project exemplifies one of the many ways GLOBE Observer connects citizen science with NASA.
About the Author:
Siddharth (Sidd) Jasti is a rising sophomore at the University of Maryland, College Park, studying computer science and business analytics. Sidd was able to intern with the GLOBE Observer team at NASA’s Goddard Space Flight Center this summer, through a program with Science Systems and Applications, Inc. and Space Systems LLC. He was mentored on this project by Holli Kohl and Kristen Weaver, coordinator and deputy coordinator for GLOBE Observer; Heather Mortimer, GLOBE Observer science writer and graphic designer; and Tina Rogerson, scientific programmer and analyst on the GLOBE Clouds team at NASA’s Langley Research Center.
Sidd would like to thank his mentors for the opportunity and for teaching him so much through this project. He appreciated the opportunity to work with the GLOBE Observer team and community to further contribute to the exploration and observation of Earth. He felt that he learned an immense amount over the summer and enjoyed the opportunity to apply his technical skills in a field to which he previously had limited exposure. Sidd would also like to thank the dedicated GLOBE Observer community for their passion and contributions, which showcase how citizen science can create real change.
Comments
View more GLOBE Observer news here.


