


News - GLOBE Observer


Chasing light to map, measure, and monitor the Lewis and Clark National Historic Trail

View of United States from Terra+Aqua-MODIS 8 day natural color composite with 2018 land cover map for the Lewis and Clark National Historic Trail area. Source: NASA Global Imagery Browse Service (GIBS) on 1 September 2019.
Introduction
When we look at satellite images of the Earth like the one shown above, the colors we see are a result of the way sunlight is reflected, along with the ability of our eyes to see red, green, and blue colors in the visible spectrum. Similar to the camera on your mobile device, sensors on orbiting satellites measure visible red, green, and blue sunlight (see Tour of Electromagnetic Spectrum). Scientists use these space-based measurements to estimate land cover such as forests, grasslands, or water, and to create maps of land cover across wide areas. The map above shows the Lewis and Clark National Historic Trail which extends 4,900 miles through 16 different states with both an auto and water route. But what do these colors actually look like on the ground, at human-scale?
To better understand the route’s current land cover conditions, this summer, we asked people to take pictures of the land cover along this area of interest, using the GLOBE Observer App.
The GO on a Trail data challenge began June 1 and ended on September 2, 2019. Thus far, participating GLOBE observers have collected and submitted hundreds of observations along the Lewis and Clark route. We are still reviewing and organizing but here are just a few of the cardinal direction images:
| Water (freshwater) Ohio River, State Point Park, Pittsburgh, Pennsylvania (westerly) on July 15, 2019 near 45.98494°, -123.93475° Source: GLOBE Observer contributor | Map |
| Urban (buildings) Louisville, Kentucky. (northerly) on August 15, 2019 near 38.25550°, -85.7530° Source: GLOBE Observer contributor | Map |
| Trees (deciduous/broadleaf) Nebraska City, Nebraska. (easterly) on June 8, 2019 near 40.66655°, -95.83215° Source: GLOBE Observer contributor | Map |
| Barren (dirt) Makoshika State Park, Montana. (easterly) on August 10, 2019 near 47.06193°, -104.66946° Source: GLOBE Observer contributor | Map |
| Urban (other); Athletic Field Athletic field with turf carpet, Montana State University, Bozeman, Montana. (Southerly) on August 6, 2019 near 45.66473°, -111.05905° Source: GLOBE Observer contributor | Map |
| Water (fresh water) + Barren (dirt)+ Herbaceous + Shrubs Missouri River, Three Forks State Park, Montana. (northerly) on August 6, 2019 near 45.92555°, -111.50428° Source: GLOBE Observer contributor | Map |
| Urban (roads/parking) + Shrubs Lolo Pass, Montana. (southerly) on August 9, 2019 near 46.635467°, -114.580345° Source: GLOBE Observer contributor | Map |
| Urban (buildings) Oregon Historical Society, Portland, Oregon. (southerly) on June 1, 2019 near 45.515792°, -122.682479° Source: GLOBE Observer contributor | Map |
| Trees (evergreen/needleleaf + deciduous/broadleaf) Fort Clatsop National Historic Park, near Astoria, Oregon. (westerly) on June 23, 2019 near 46.13298°, -123.88029° Source: GLOBE Observer contributor | Map |
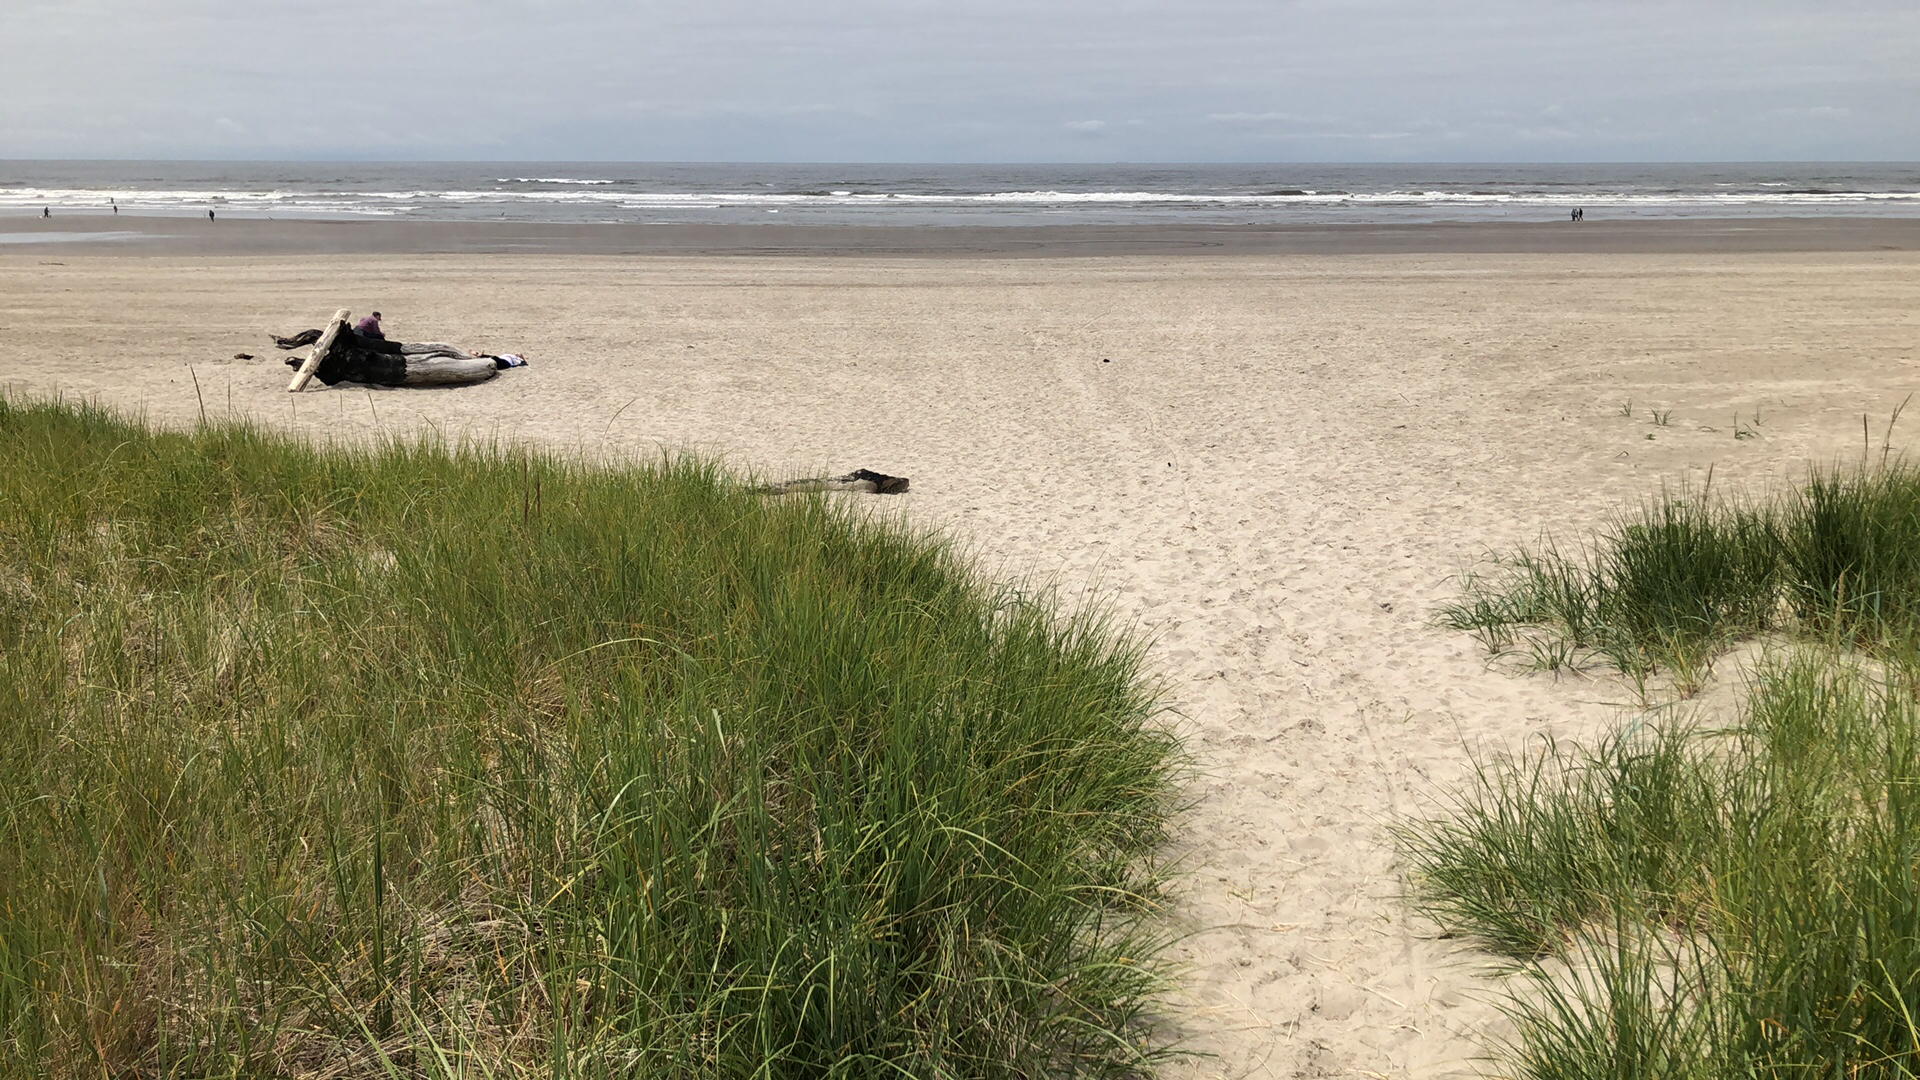
| Barren (sand) + Herbaceous Pacific Ocean, Seaside, Oregon. (westerly) on June 23, 2019 near 45.98494°, -123.93475° Source: GLOBE Observer Contributor |


How will this data contribute to science?
Lewis and Clark’s journals provide a scientific point of reference for the land conditions over 150 years before the first satellite images of the earth were produced. These satellite images have been used to create maps of Earth which build upon the science legacy of early map-makers. GLOBE Observers are contributing to a modern scientific journal, this time produced by many people, using tools like the camera and GPS on your mobile devices which are organized with the GLOBE Observer software. Researchers, students, and decision-makers can use these ground observations on their own or compare them to satellite images, models, or maps they create.
Earth is dynamic and diverse. It would be easier to measure, map, and monitor resources if trees didn’t grow, people didn’t build things, or natural hazards like floods, fires, or droughts didn’t occur. The 50-years of satellite-based Earth observations have shown there is a need for continually monitoring and updating land cover maps to improve the ability for communities to predict, respond, and recover when changes occur. To this end, NASA and the United States Geological Survey (USGS) both fund land cover change monitoring and research programs such as NASA Land Cover, Land Use, Change (LCLUC), NASA Earth Science Disasters Program, and USGS Land Change Monitoring, Assessment, and Projection (LCMAP).
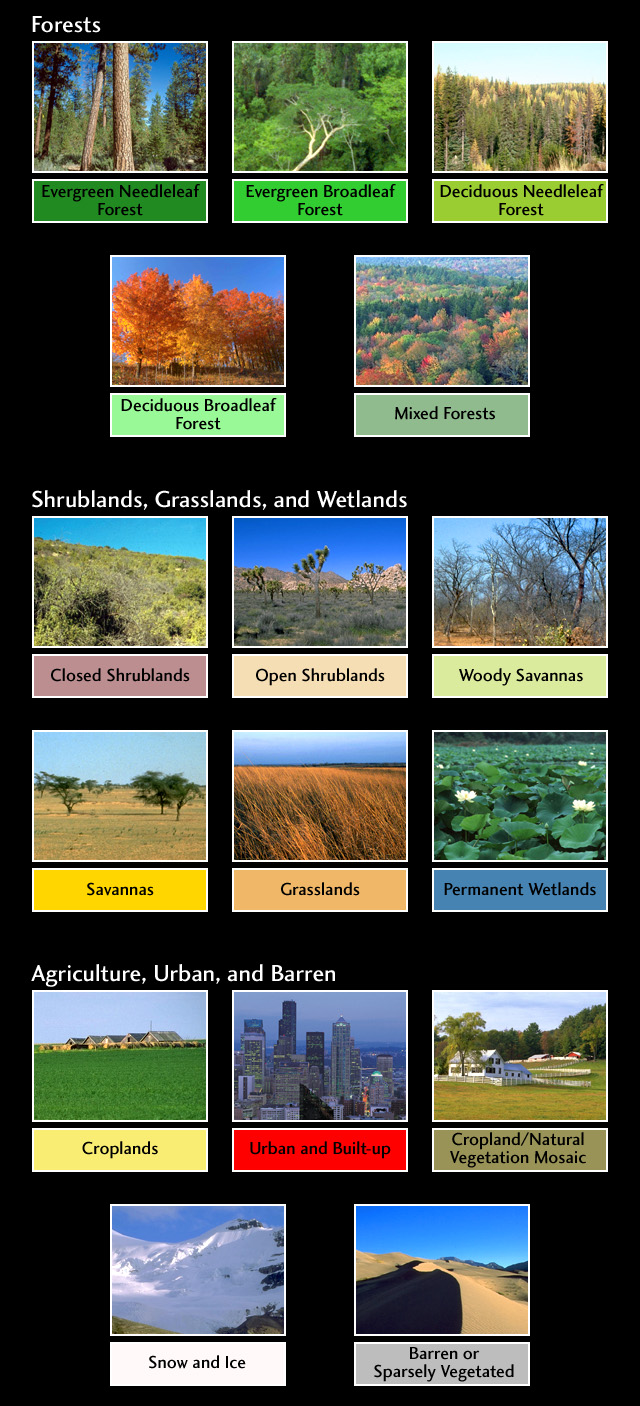
To contribute to this scientific effort, and as a first estimate for understanding the current Lewis and Clark National Historic Trail’s land cover, we are looking at the most recently available, peer-reviewed, global-scale land cover map from satellite measurements for the year 2018. As the creators of this dataset acknowledge, there can be an over-estimation or under-estimation of different land cover types which is why it is useful to use GLOBE Observer to capture the on-the-ground conditions that can be compared to a map. Importantly, since this is a global land cover map, it provides a way to extend our findings to other GLOBE-affiliated countries. In addition to the GLOBE Observer app, another place you can explore this global land cover map yourself is here at the NASA Worldview. Each color signifies a different type of land cover as shown by this picture key available here.


Earth is dynamic: get involved and map your community!
Although the summer 2019 GO on a Trail data challenge has ended, the need to map, measure, and monitor Earth continues. Land cover is everywhere, so find a place in your community and measure (capture) what you see on trails, in parks, neighborhoods – anywhere! The science we are asking you to do is straight-forward when you follow the land cover protocol in the GLOBE Observer mobile app: you are taking pictures in a consistent manner, describing what you see, and then archiving this observation with The GLOBE Program. The Land Cover tool guides you through the process of taking pictures with your phone in four directions, and up and down. You can simply upload your images or you can add labels and description of the land cover objects you see in each direction. Do you see trees? Grass? Water? All of the above? This allows all of us to know what’s there and how it changes over time. I hope that you will join us in the science of mapping, measuring, and monitoring Earth.

Resources:
- GO on a Trail Map: https://nps.maps.arcgis.com/apps/View/index.html?appid=2333dde6dbf04b789ba3170fe5d5fe4e
- Tour of the electromagnetic spectrum: (https://science.nasa.gov/ems)
- Lewis and Clark From Space StoryMap: (https://www.nps.gov/articles/the-lewis-and-clark-trail-from-space.htm)
- NASA LCLUC Program
- NASA Earth Science Disasters Program
- USGS Land Change Monitoring, Assessment, and Projection (LCMAP)
Friedl, M., Sulla-Menashe, D. (2019). MCD12Q1 MODIS/Terra+Aqua Land Cover Type Yearly L3 Global 500m SIN Grid V006[Data set]. NASA EOSDIS Land Processes DAAC. Accessed 2019-08-30 from https://doi.org/10.5067/MODIS/MCD12Q1.006
Peder Nelson M.S., is the Land Cover science lead for GLOBE Observer. In addition, he is an Instructor of Geography and Geospatial Science and researcher in the Environmental Monitoring, Analysis, and Process Recognition (eMapR) Lab in the College of Earth, Ocean, Atmospheric Sciences at Oregon State University. With a background in environmental education, biological sciences, and land management, he uses remote sensing and geographic information systems to create maps and data that show people what is happening on planet Earth, particularly changes that can be seen from space.
Twitter: @pedervnelson and http://emapr.ceoas.oregonstate.edu/
Comments

View more GLOBE Observer news here.