Eclipse 2017 Data - GLOBE Observer
Eclipse Data - August 21st, 2017
Air Temperature Data
Because the eclipse is such a time-focused event, we have also been able to pull some data sets that might be useful for a variety of people, and could save time in accessing the data. See below for air temperature data sets pulled by state and country for the date of 8/21/2017. Files are in zipped folders unless noted, and can be downloaded as comma separated value (CSV) files, or Excel (XLSX) files, which preserves some formatting that may make them easier to work with.
Observations submitted through the GO app receive a unique identifier for each location from which data are submitted. The identifier is tagged to the latitude and longitude information of the submission, which is automatically obtained through the device being used to run the GO app. Each unique identifier is considered an independent unique observer for our purposes. The time of each observation was recorded to the nearest minute. The observer could choose to input temperature as either Fahrenheit or Celsius, but the temperature values were recorded in the database to the nearest degree Celsius.
| Description | File Type | |
|---|---|---|
| Air temperature data from the fourteen states that experienced totality in some portion of the state: Georgia, Idaho, Illinois, Iowa, Kansas, Kentucky, Missouri, Montana, Nebraska, North Carolina, Oregon, South Carolina, Tennessee, and Wyoming | CSV | XLSX |
| Air temperature data from the remaining 36 U.S. states, which experienced only a partial eclipse, reaching varying levels of maximum obscuration of the Sun | CSV | XLSX |
| Air temperature data from the entire United States (single file, not a zipped folder) | CSV | XLSX |
| Air temperature data from other areas that experienced the eclipse, grouped as follows: Canada, Central America, Dominican Republic, Mexico, northern South America and Puerto Rico | CSV | XLSX |
Clouds Data
| Description | File Type | |
|---|---|---|
| File with total cloud cover from the citizen scientists with the total cloud cover reported by satellites for those in the path of totality within the contiguous U.S. | XLSX | |
General notes about the files:
- For latitude and longitude, a negative sign represents south and west respectively.
- Elevation is measured in meters above sea level.
- "Measured at" time is in Coordinated Universal Time, or UTC (also sometimes referred to as UT). Here is one time conversion tool, but there are many others available as well.
- Air temperature (may appear as "measured value" if you pull from the GLOBE system rather than our files above) is in degrees Celsius.
Other useful resources:
- To find out the times for the beginning, ending and totality/maximum eclipse for a particular observation point (which might be useful in your analysis), you can use the interactive eclipse map on NASA's eclipse page. The U.S. Naval Observatory also has an online form to calculate the same data if you prefer to enter the latitude and longitude rather than using the map.
This video shows a quick view of the more than 80,000 air temperature measurements collected during the total solar eclipse on August 21st, 2017.

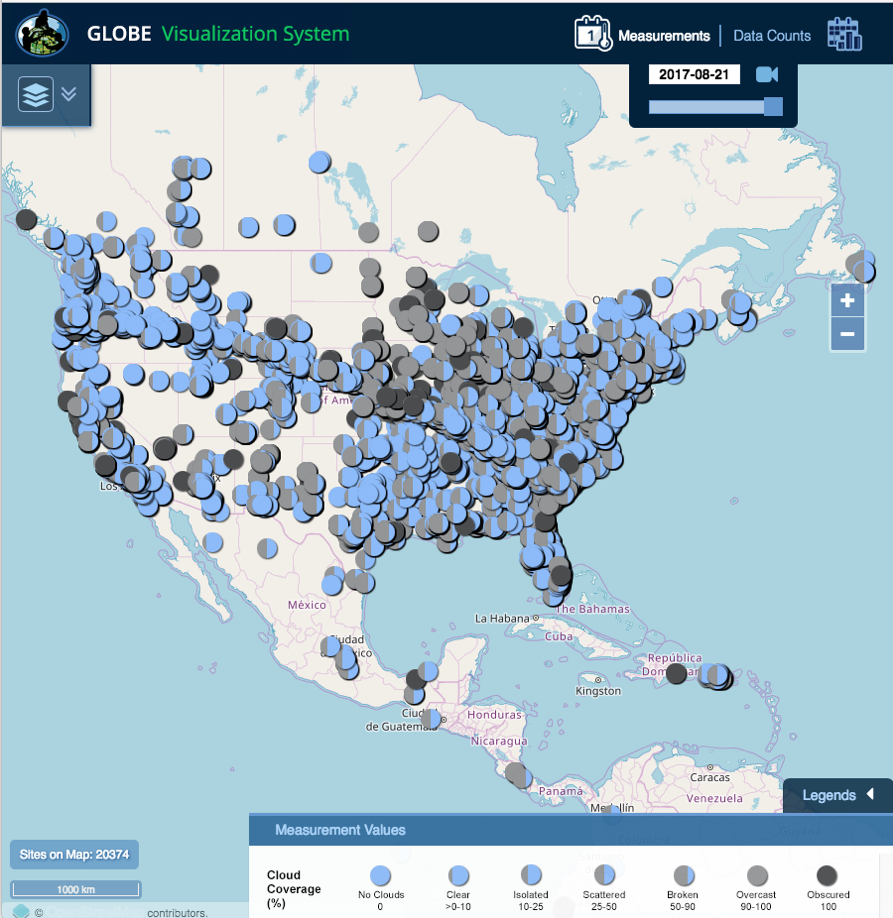
This map shows the more than 20,000 cloud observations (with 60,000 photos) collected during the total solar eclipse on August 21st, 2017.


