Eclipse Overview - GLOBE Observer
What is GLOBE Eclipse?
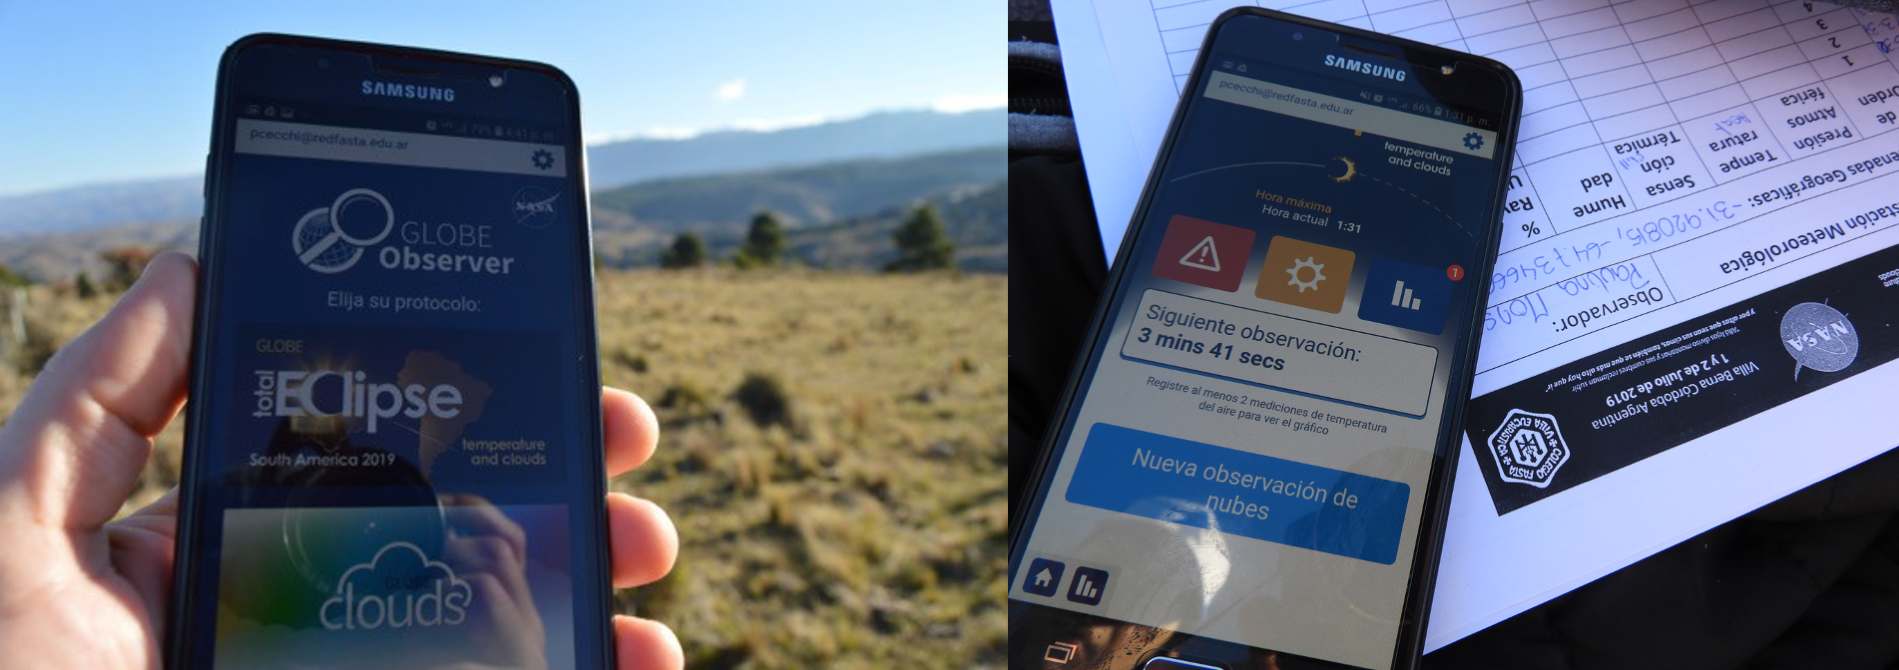
GLOBE Eclipse is a temporary tool in the GLOBE Observer app (details about downloading the app) that will help you document air temperature and clouds during an eclipse. The tool is not visible in the app on a regular basis, but is only opened up when a solar eclipse is happening somewhere in the world. The Eclipse tool will prompt you to take air temperature measurements using a meteorological thermometer, as well as taking regular observations of sky conditions using the Clouds tool, and an observation with the Land Cover tool to characterize the vegetation near the data collection site. For more details about equipment needed, how to take observations, and frequently asked questions, visit the Taking Observations page. Our Resource Library includes additional activities, references and videos. In addition, additional resources (including presentation slides) for facilitators leading a program related to the eclipse can be found in the eclipse section of the Toolkit for Informal Educators. We also have a Media Kit including videos, graphic assets, b-roll, and other resources
Image source: GLOBE School Colegio Fasta Villa Eucarística in Argentina, taken during the July 2019 eclipse.
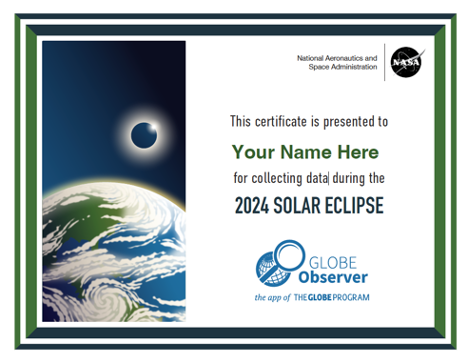
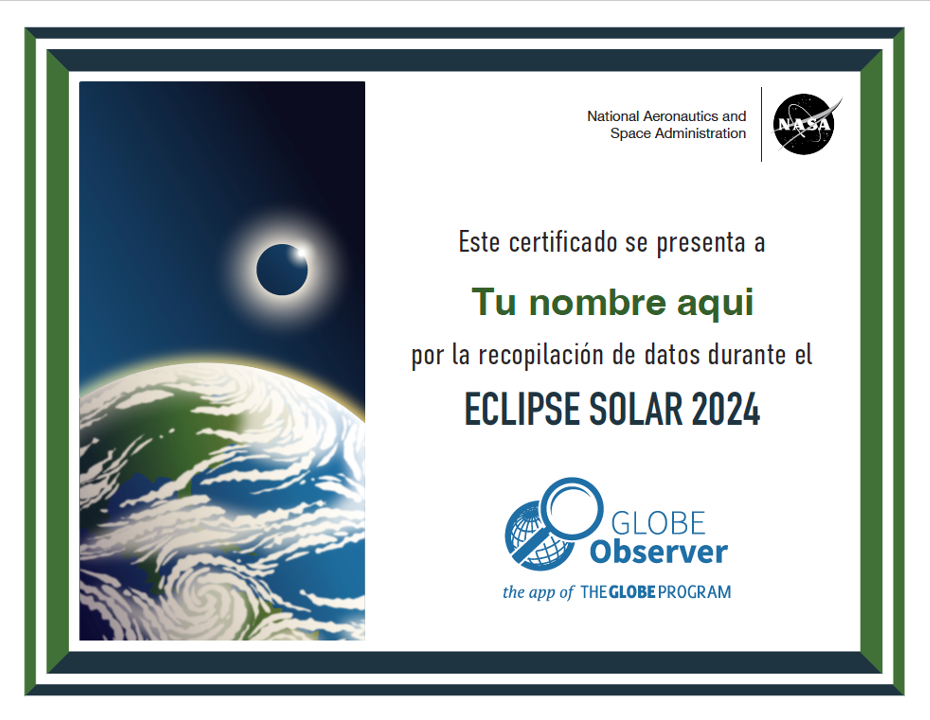
The Eclipse tool is not currently visible in the app. You can see your previous observations via the My Observations button in the app, and via the link at the top of this page if you are logged in to your account. We also have a certificate (see below) available for you to download and customize with your name.
| Certificate in English | Certificado en español |
|---|---|
 |
 |
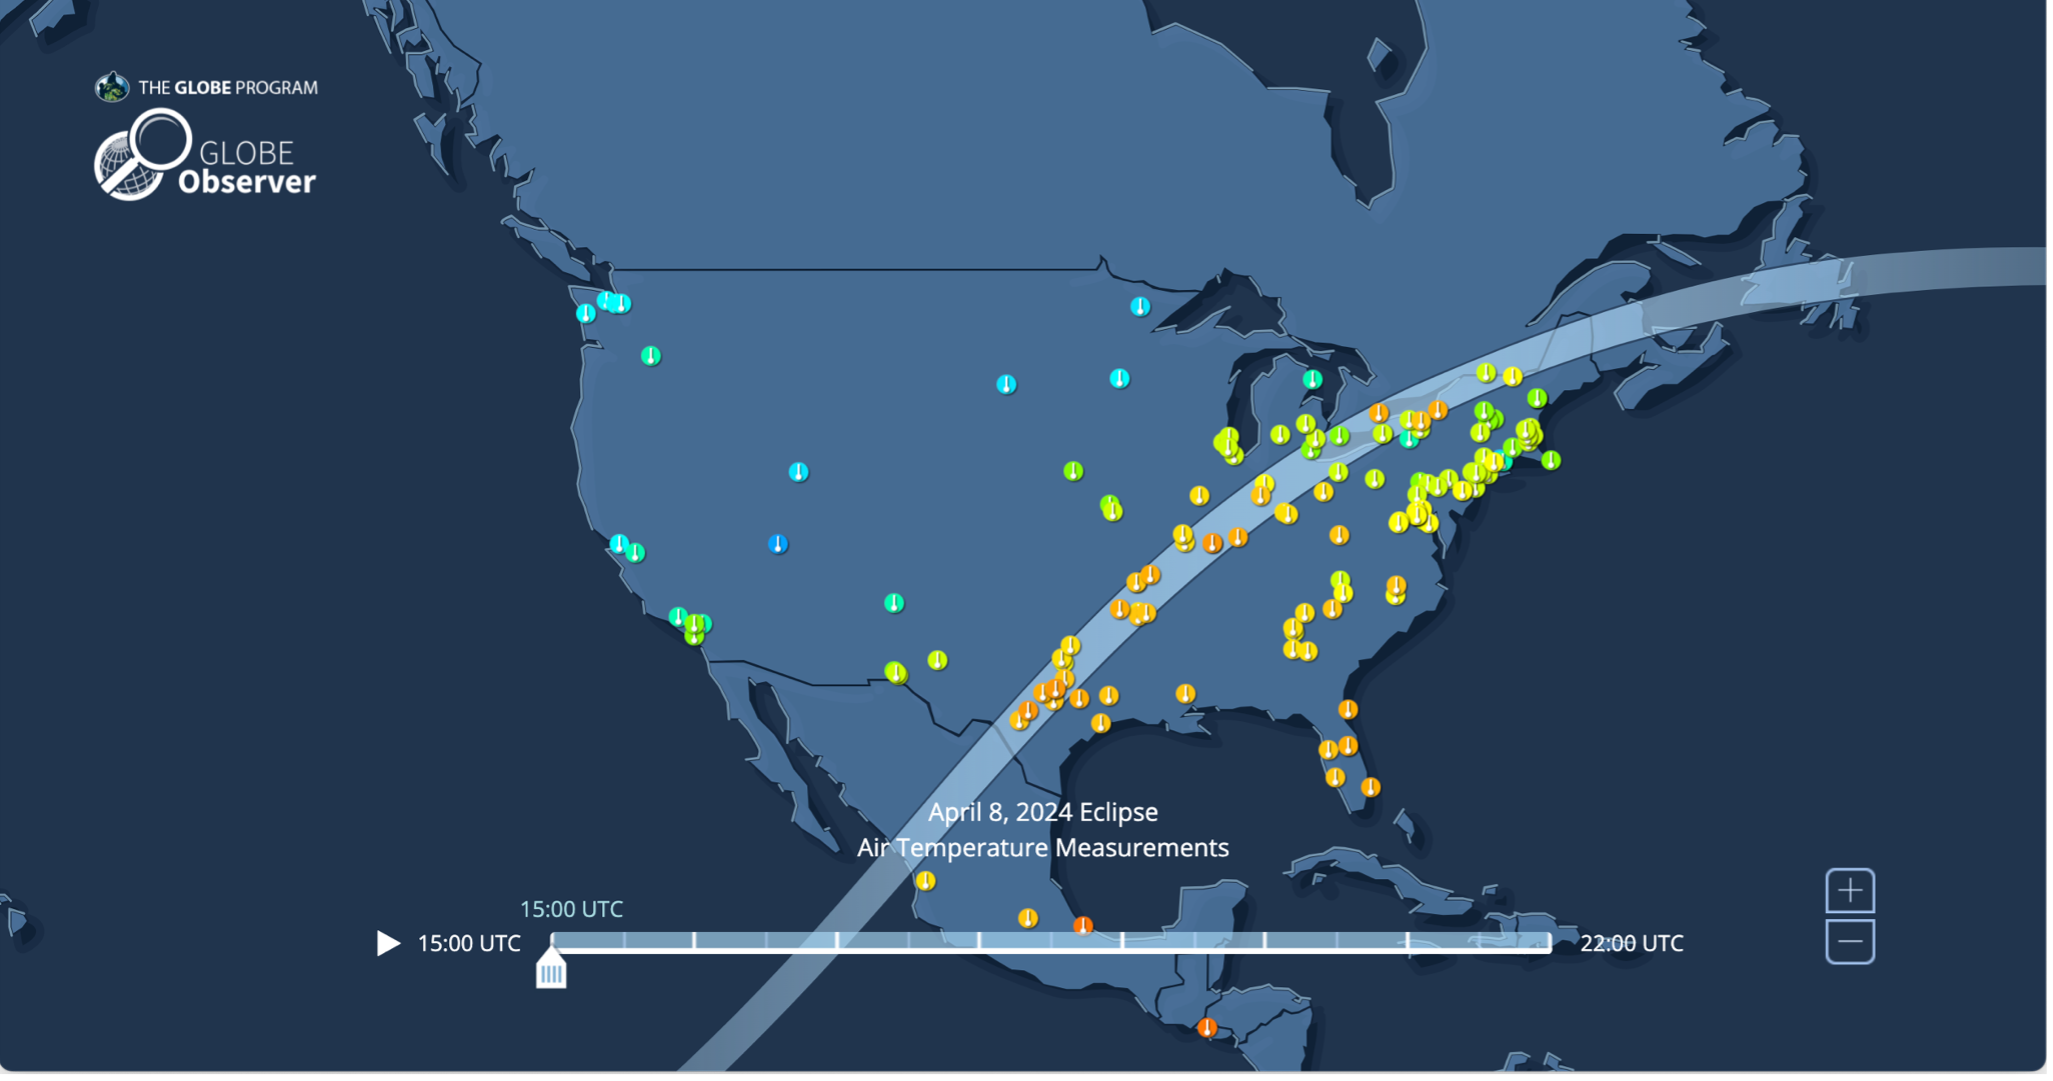
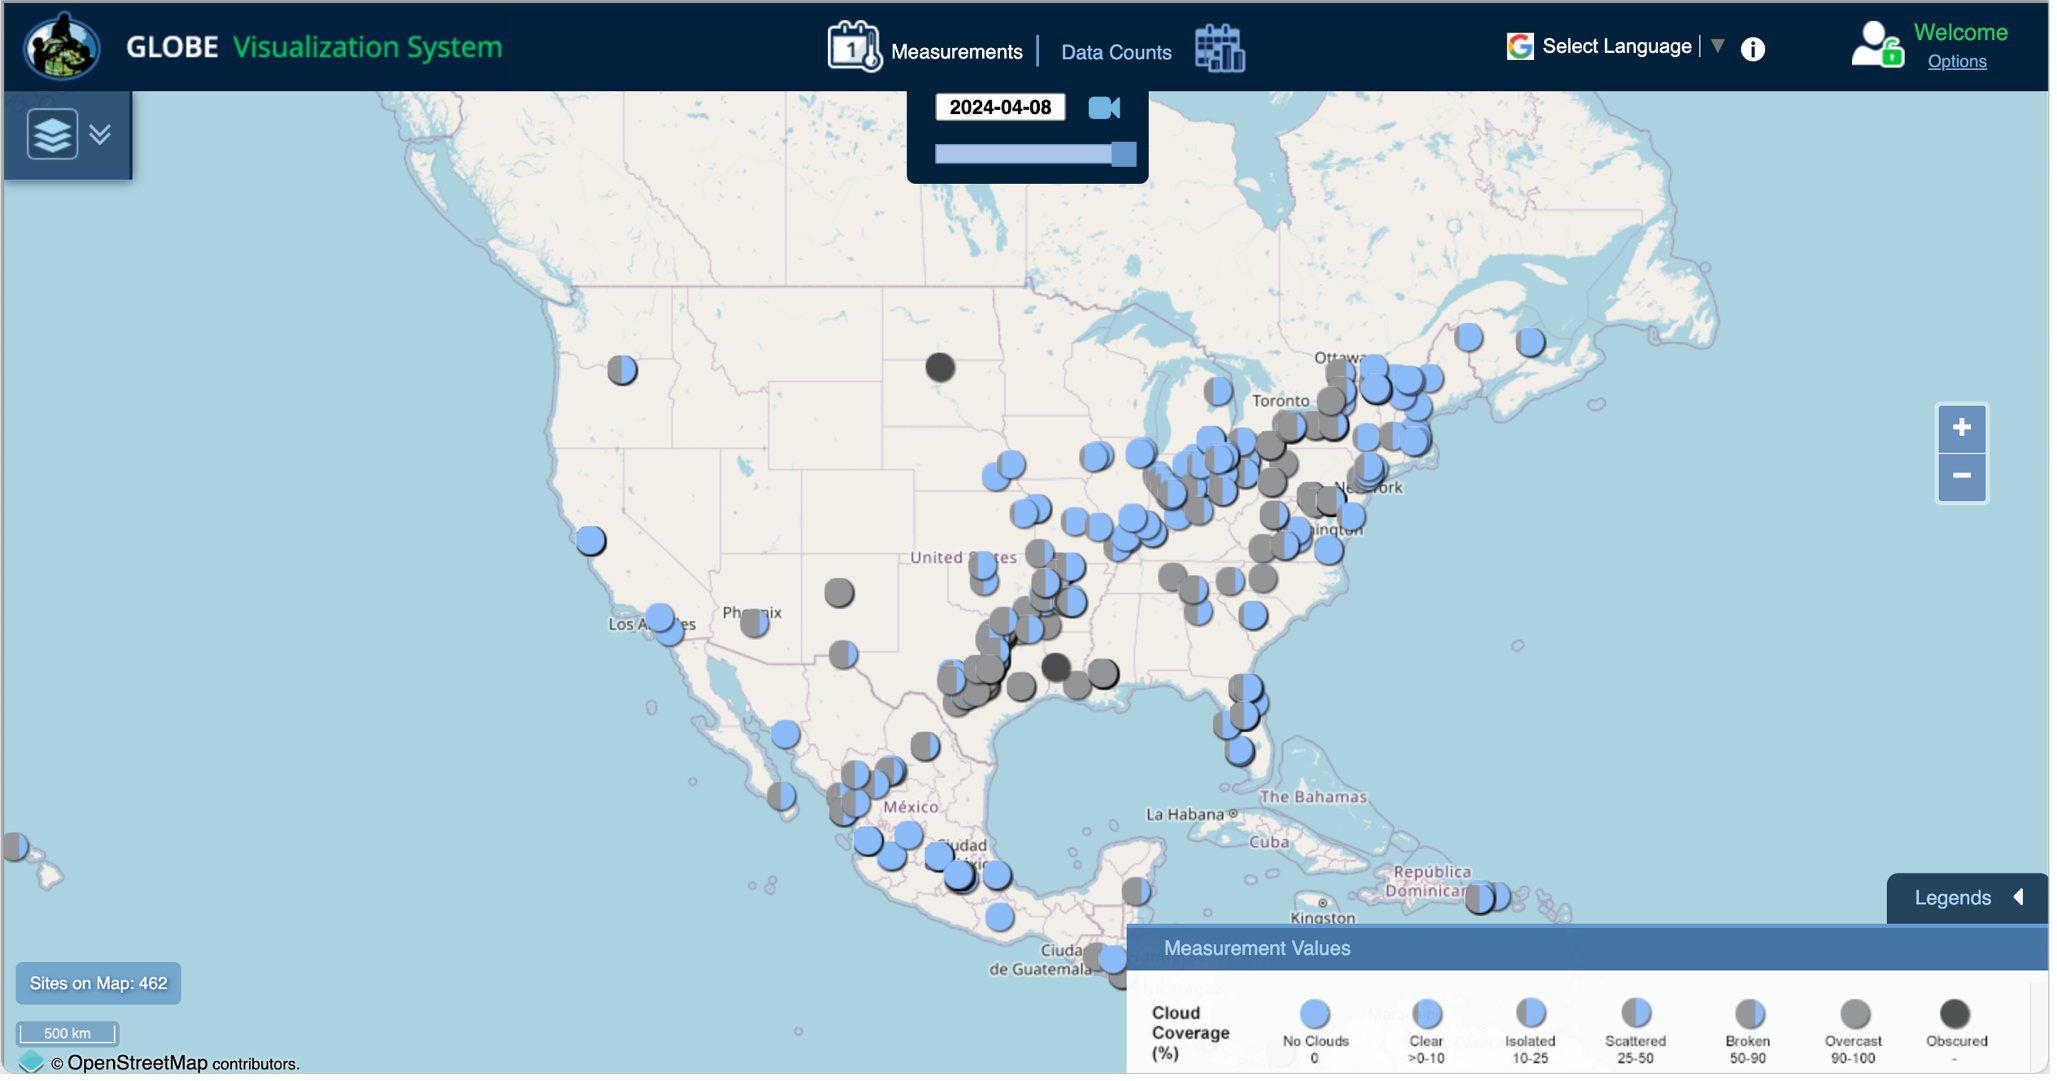
View the air temperature data on eclipse day.
View the cloud data on eclipse day.
View the map of the air temperature data from the annular eclipse, 14 October 2023.
How to observe eclipses with GLOBE
Why are my observations important?
Energy from the Sun warms our planet, and changes in sunlight can also cause changes in temperature, clouds, and wind. What happens when the Sun is blocked by the Moon during an eclipse? How will the eclipse affect these solar-powered processes?
During an eclipse, citizen scientists are able to:
- Observe how the eclipse changes atmospheric conditions near you by reporting on clouds and air temperature
- Report surface conditions (photograph and describe the landscape) that may have an impact on differences in the atmospheric effects in varying locations
- Contribute to a citizen science database used by scientists and students to study the effects of eclipses on the atmosphere
- Provide comparison data even if they are not in the path of totality
While the Eclipse tool is not regularly available in the app, we plan to reopen it for future eclipses that pass through GLOBE countries. In between eclipses, we have some examples of how to analyze and graph GLOBE eclipse data, and you can download curated eclipse data sets for your own explorations.
The Eclipse tool is available now leading up to the 08 April 2024 eclipse!
Viewing Eclipses Safely
During a total solar eclipse, the only safe time to view the Sun without protection is the few minutes of totality, when the Sun is completely blocked by the Moon. Viewing any part of the bright Sun through a camera lens, binoculars, or a telescope without a special-purpose solar filter secured over the front of the optics will instantly cause severe eye injury.
When watching partial phases of a solar eclipse directly with your eyes, you must look through safe solar viewing glasses (“eclipse glasses”) or a safe handheld solar viewer at all times. Solar viewing glasses are NOT regular sunglasses; regular sunglasses, no matter how dark, are not safe for viewing the Sun. Safe solar viewers are thousands of times darker and must comply with the ISO 12312-2 international standard. Always inspect your eclipse glasses or handheld viewer before use; if torn, scratched, or otherwise damaged, discard the device. Always supervise children using solar viewers.
For more about eclipse safety, including indirect ways to view the eclipse without eclipse glasses, please visit the main NASA Eclipse Safety website.
Data On NOAA's Science on a Sphere
 NOAA's Science On a Sphere program and the GLOBE Program are collaborating to display your data at nearly 200 museums and science institutions around the world that have Science On a Sphere. You may have one close to you! We also have a mobile version that you can download. Science On a Sphere is a spherical visualization display system that presents amazing Earth data and visualizations. For the 2024 eclipse we will use it to display the data you collect on the 2023 eclipse! You will be able to see how temperature changes across the country on a 6 foot sphere or even in your own phone, and learn more about how community science can provide amazing data for science and education."
One Million Acts of Science For Citizen Science Month:
The next eclipse falls in April, which is Citizen Science Month! You can be part of One Million Acts of Science during Citizen Science Month, which incorporates hundreds of events and thousands of people collectively logging one million acts of science in just one month!
Past Eclipses
During the total solar eclipse on 21 August 2017, with a path of totality spanning the United States, more than 10,000 observers helped us collect over 20,000 cloud observations with 60,000 photos and 80,000 air temperature measurements to answer these questions and others using the GLOBE Observer app. (See the 2017 version of this page.)
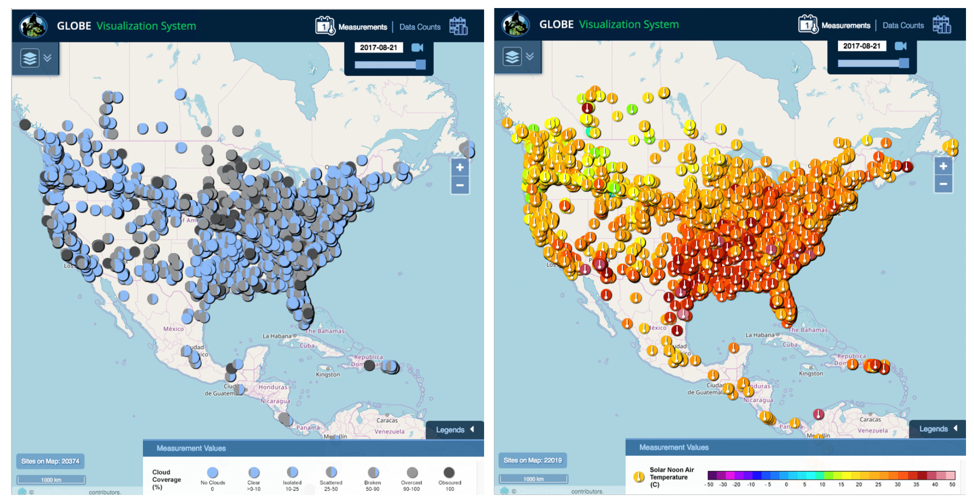
Clouds observations (left) and air temperature measurements (right) from 21 August 2017, GLOBE Visualization System.
For the total solar eclipse on 02 July 2019, the path of totality went across Chile and Argentina. An area with less overall population than the 2017 eclipse, we received 73 clouds observations and 1727 air temperature measurements on the day of the eclipse.
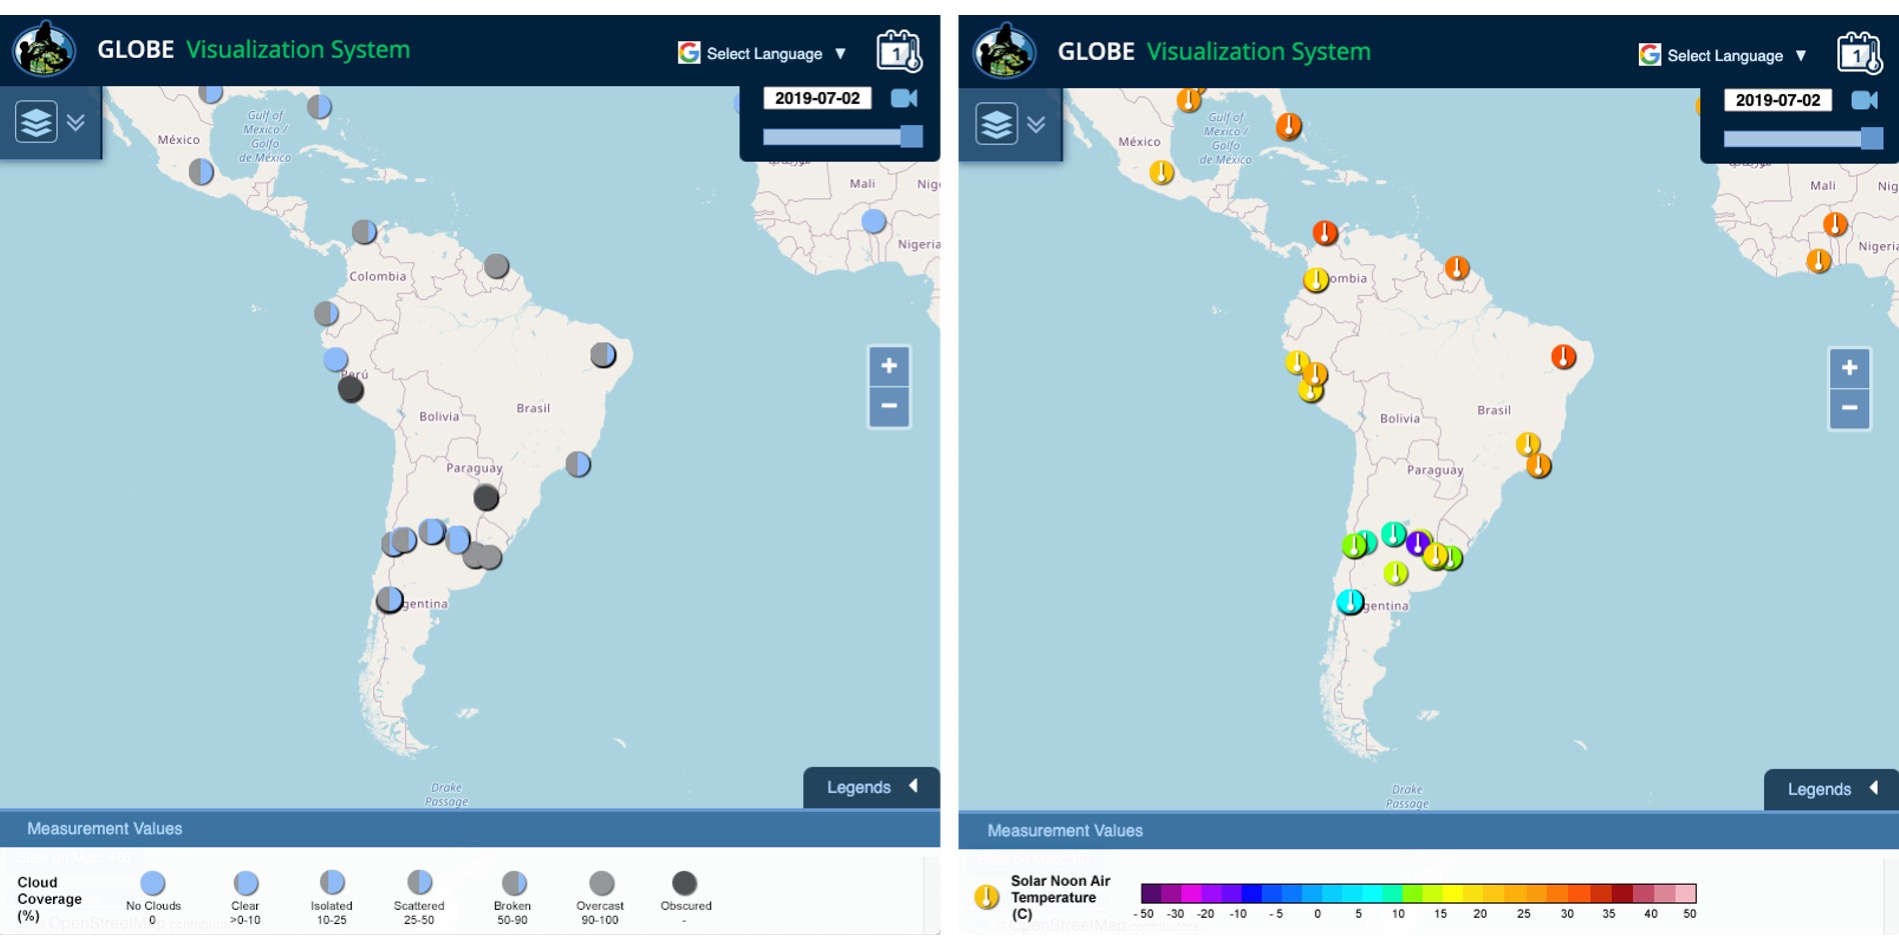
Clouds observations (left) and air temperature measurements (right) from 02 July 2019, GLOBE Visualization System.
For the total solar eclipse on 14 December 2020, the path of totality also went across Chile and Argentina, a bit further south than the 2019 eclipse. We received 856 air temperature measurements from the area experiencing the eclipse, as well as 232 clouds observations. These represent contributions from nearly 100 unique observers. Read more in the summary news article about the event.
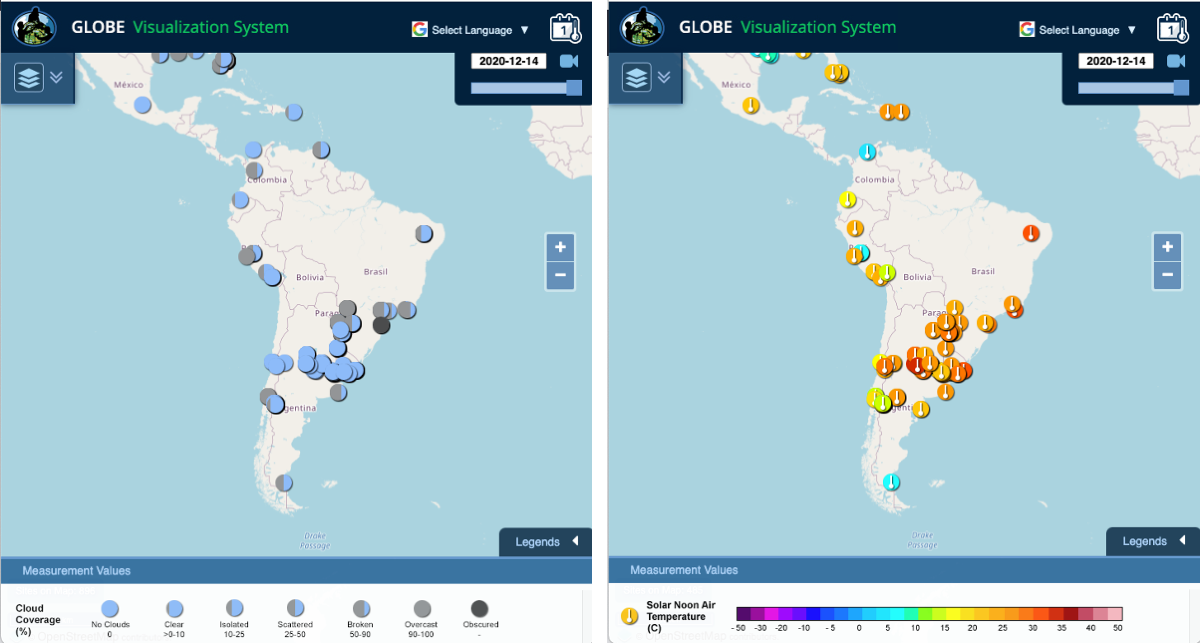
Clouds observations (left) and air temperature measurements (right) from 14 December 2020, GLOBE Visualization System.
The video below was created for the eclipse in August 2017, but explains why NASA needs your help making observations during any eclipse.
Student Research
In addition to research done by professional scientists, because GLOBE Observer is part of the GLOBE Program, which is active in thousands of schools across the world, citizen scientists are strengthening science education by providing data for student research.
Here are a few examples of student research reports related to eclipses:
"Analysis of Data Collected During the 2017 Solar Eclipse at Eighty Percent Totality," by Maysam Aidibi, Leanne Alawieh, Ali Eter, Sara Komaiha, and Hana Salami, students from Crestwood High School in Dearborn, Michigan, USA; GLOBE Teacher, Diana Johns; submitted to GLOBE on 01 March 2018.
“Eclipse total de sol y su influencia en las condiciones ambientales” [Total eclipse of the sun and its influence on environmental conditions], by a class of 25 students from the Colegio Fasta Villa Eucarística in Córdoba, Argentina; GLOBE Teacher Franco Iacono; submitted to GLOBE on 09 March 2020.
"El comportamiento de las palomas durante el Eclipse Solar 2019" [The behavior of pigeons during the Total Solar Eclipse of 2019], by students from the Escuela Primaria Particular Incorporada N°1345 Nuestra Señora del Carmen in Pujato, Argentina; GLOBE Teacher Claudia Romagnoli; submitted to GLOBE on 01 January 2020.
“Cambios de la intensidad de luz y temperatura del aire en ocasión de un eclipse total de sol (14 de diciembre de 2020)” [Changes in the intensity of light and air temperature on the occasion of a total solar eclipse (14 December 2020)], by Bruno Lacarpia Berenguer and Luciana Agostina Rivas Troncoso, from EPET No. 4, Junín de los Andes, Argentina; GLOBE Teacher Paula Berenguer; submitted to GLOBE on 08 March 2021.
“Effect of total sun eclipse on meteorology and cosmic ray flow,” by Marianela Pepe, Lucio Martínez, and Juan Wehinger, Science Club Huechulafquen, Junín de los Andes, Argentina; GLOBE Teachers Ana Prieto and Jorge Pepe; submitted to GLOBE on 09 March 2021.
“Efectos del eclipse solar en el comportamiento de especies de avifauna y hormigas en el predio escolar” [Effects of the solar eclipse on the behavior of bird species and ants on the school premises], by a group of students from Escuela No. 88 Alfredo B. Nobel, Canelones, Uruguay; GLOBE Teacher Dario Greni; submitted to GLOBE 10 March 2021.
For a full listing of research reports on a variety of topics, visit the GLOBE Student Research Reports page.
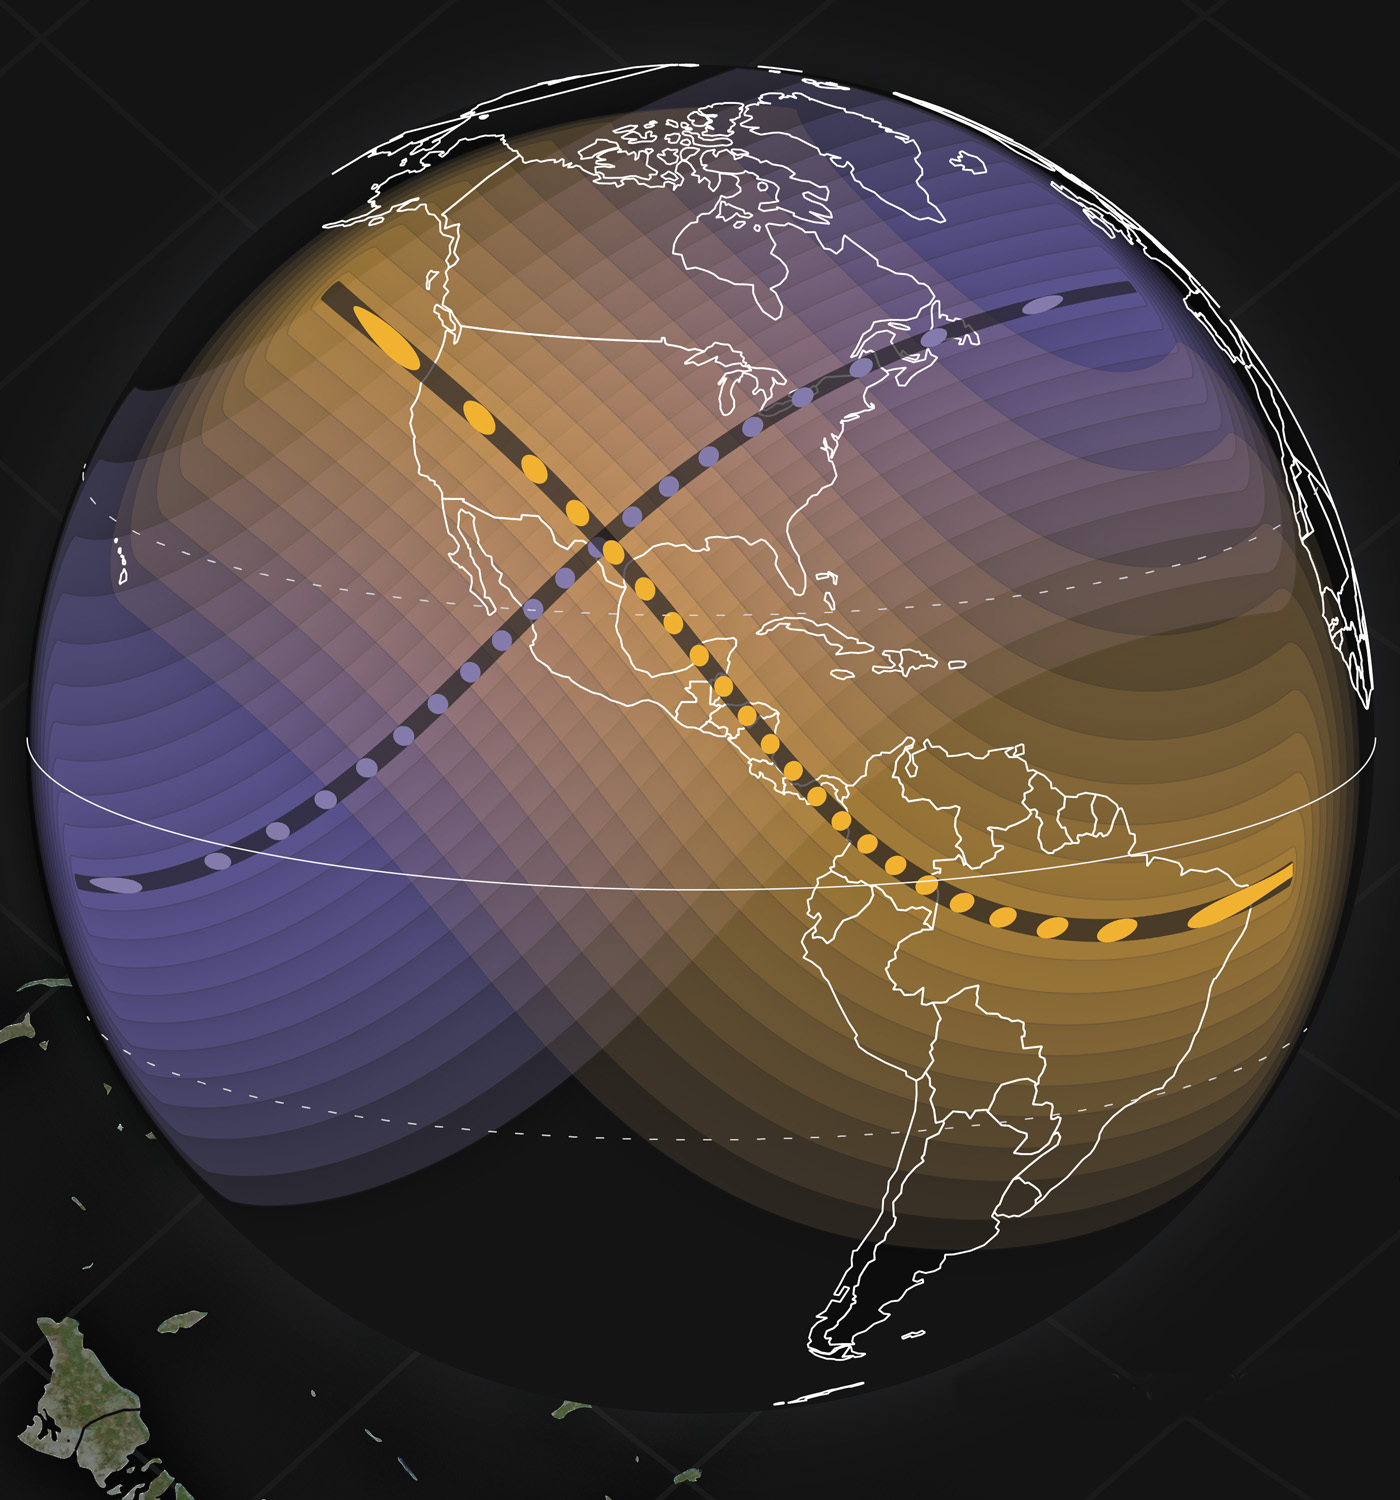
Image source: NASA's Scientific Visualization Studio ![]()
The next total solar eclipse will take place on 08 April 2024 and the path of totality will pass across North America, including Canada, the United States and Mexico (the lower left to upper right path with blue circles in the diagram above). Outside this path, a partial solar eclipse will be visible in Greenland and Central America. To find out exactly how much of the eclipse a particular location will experience, visit this map of the 2024 eclipse ![]() , or the U.S. Naval Observatory's Solar Eclipse Calculator
, or the U.S. Naval Observatory's Solar Eclipse Calculator ![]() . The NASA Eclipse Explorer web app
. The NASA Eclipse Explorer web app ![]() also displays eclipse information for U.S. locations.
also displays eclipse information for U.S. locations.
You can also find a full listing of upcoming solar eclipses (total, partial and annular) here ![]() .
.


